
We read your photo as:
Calculate GNP and GDP per capita for both years, showing all workings.
ScanSolve AI Answer
Answers
4 partsStep-by-step solution
5 stepsHere's the national income and economic growth analysis:
Part a· 2 steps
Calculate GNP for BOTH years
Calculate Net Factor Income from Abroad (NFIA) for each year.
For Year 1:
For Year 2:
Calculate GNP for each year.
For Year 1:
For Year 2:
The GNP for both years are:
- Year 1:
- Year 2:
Part b
Calculate GDP per capita for BOTH years
Calculate GDP per capita for each year.
For Year 1:
For Year 2:
The GDP per capita for both years are:
- Year 1:
- Year 2:
Part c
Calculate GNP per capita for BOTH years
Calculate GNP per capita for each year.
For Year 1:
For Year 2:
The GNP per capita for both years are:
- Year 1:
- Year 2:
Part d
Has PNG achieved economic growth between Year 1 and Year 2? Justify your answer using your calculated figures
Compare GDP and GNP figures between Year 1 and Year 2.
- GDP increased from K18 billion (Year 1) to K22 billion (Year 2).
- GNP increased from K17.5 billion (Year 1) to K21.5 billion (Year 2).
- GDP per capita increased from K2,000 (Year 1) to K2,315.79 (Year 2).
- GNP per capita increased from K1,944.44 (Year 1) to K2,263.16 (Year 2).
Yes, PNG has achieved . This is justified by the increase in both its total GDP and GNP, as well as its GDP per capita and GNP per capita, from Year 1 to Year 2. All key indicators of economic output and average individual income show an upward trend.
Try one yourself
A new problem that tests the same skill.
Still stuck on this one?
Ask a follow-up, and the answer starts from this question.
More Economics Questions
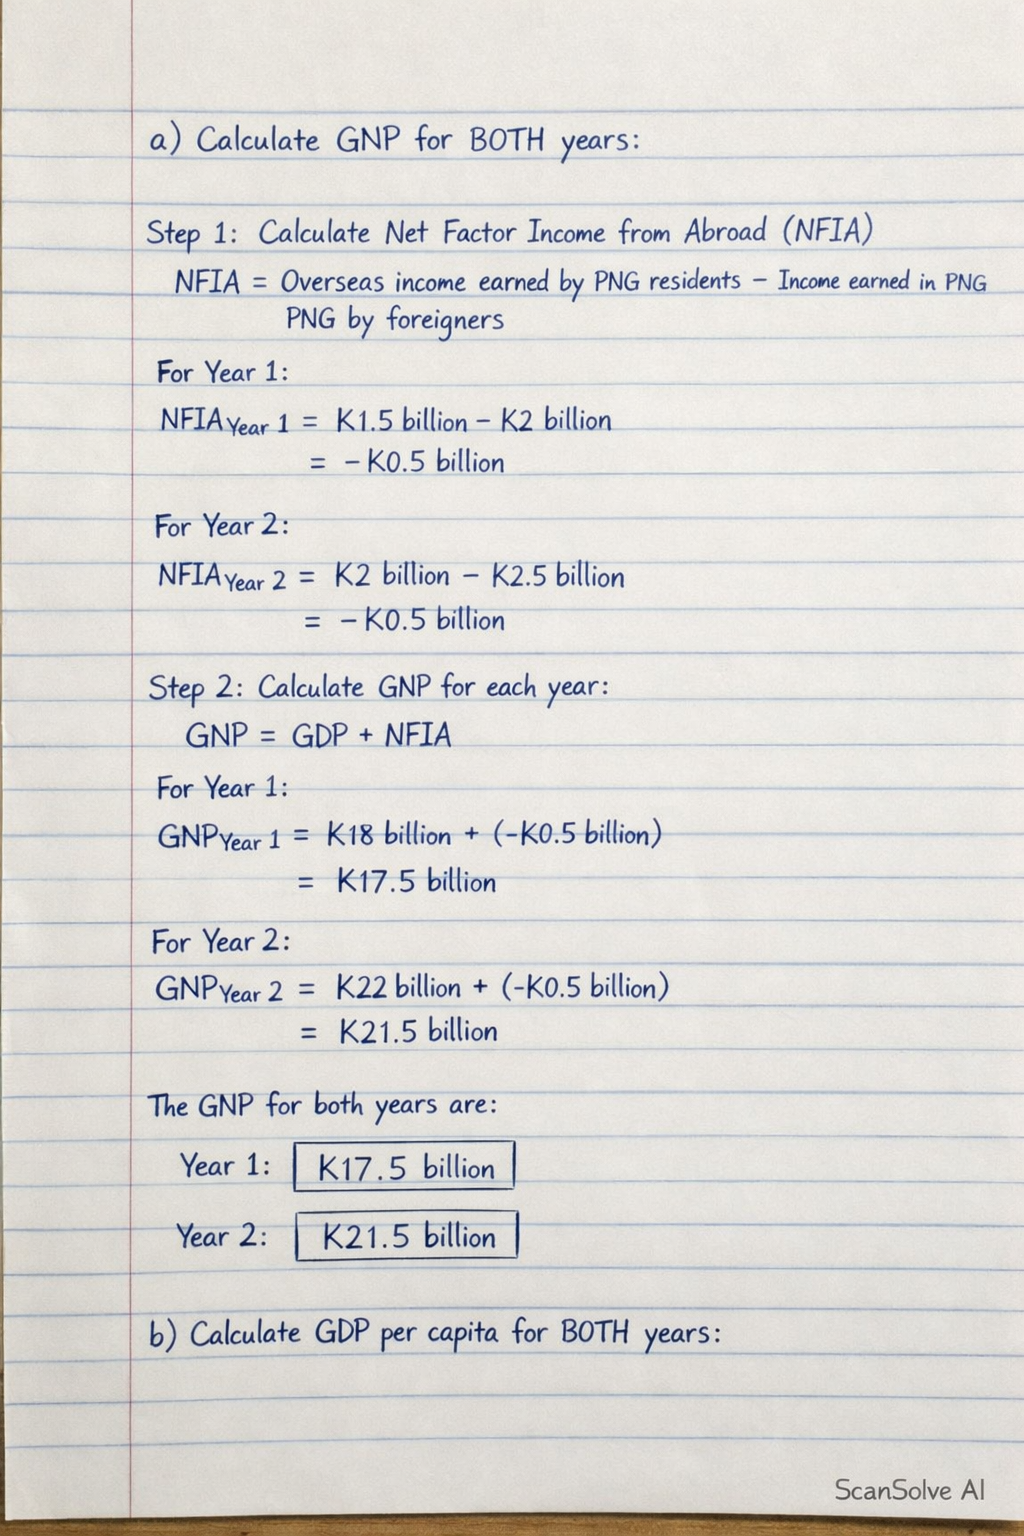
Handwritten Step-by-Step Solution
Get this as a handwritten image on WhatsApp — like a tutor wrote it for you.
Try on WhatsApp