
We read your photo as:
Indicate on the graph with the introduction of Minimum wages rate W1 there will be an increase in labour supply from Qs to Qr. Mark and label the graph correctly. Mark and label the graph correctly what will be the effect of the excess supply of labour.
ScanSolve AI Answer
Step-by-step solution
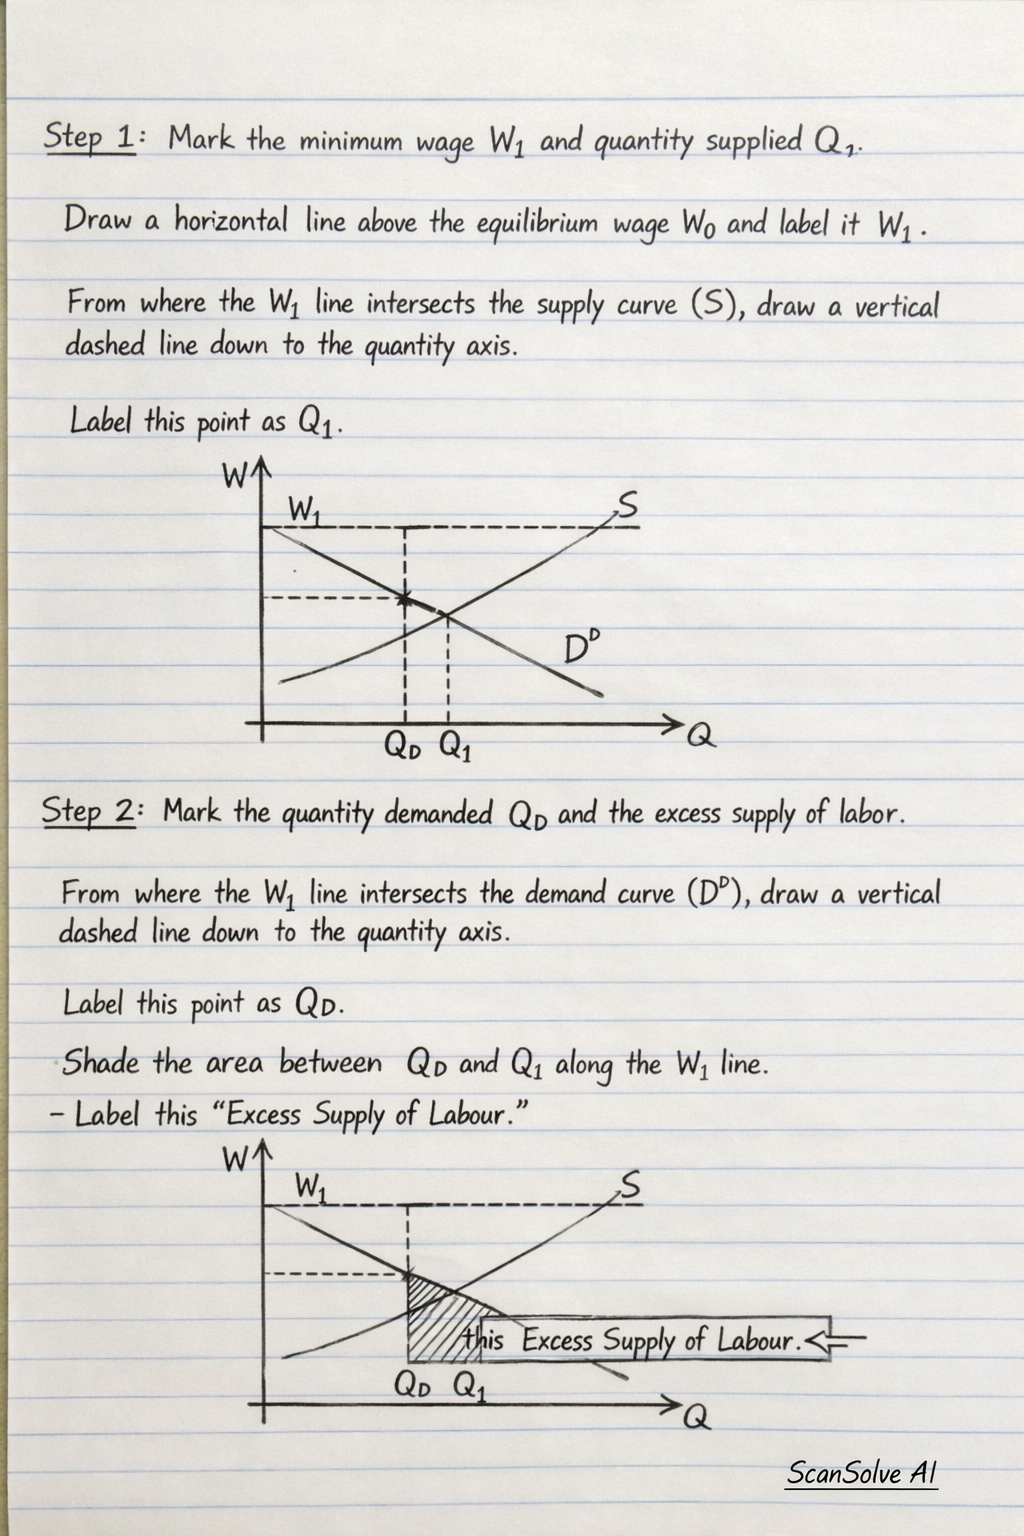
3 stepsMark the minimum wage and quantity supplied .
Draw a horizontal line above the equilibrium wage and label it . This line represents the minimum wage. From the point where the line intersects the supply curve (S), draw a vertical dashed line down to the quantity axis. Label this point on the quantity axis as . This indicates the quantity of labor supplied at the minimum wage .
Mark the quantity demanded and the excess supply of labor.
From the point where the line intersects the demand curve (), draw a vertical dashed line down to the quantity axis. Label this point on the quantity axis as . This indicates the quantity of labor demanded at the minimum wage . The horizontal distance between and on the quantity axis represents the excess supply of labor. This segment should be clearly marked on the graph, for example, by shading the area between and along the line, or by drawing an arrow between and and labeling it "Excess Supply of Labour" or "Unemployment".
State the effect of the excess supply of labor.
The effect of the excess supply of labor is an increase in unemployment. At the minimum wage , more people are willing to work () than firms are willing to hire (), leading to a surplus of labor.
The effect of the excess supply of labor is:
- Unemployment
Still stuck on this one?
Ask a follow-up, and the answer starts from this question.
More Economics Questions
Handwritten Step-by-Step Solution
Get this as a handwritten image on WhatsApp — like a tutor wrote it for you.
Try on WhatsApp