
This economics question tests your understanding of economic models and analysis. The step-by-step answer below applies the relevant framework and explains the reasoning.
ScanSolve AI Answer
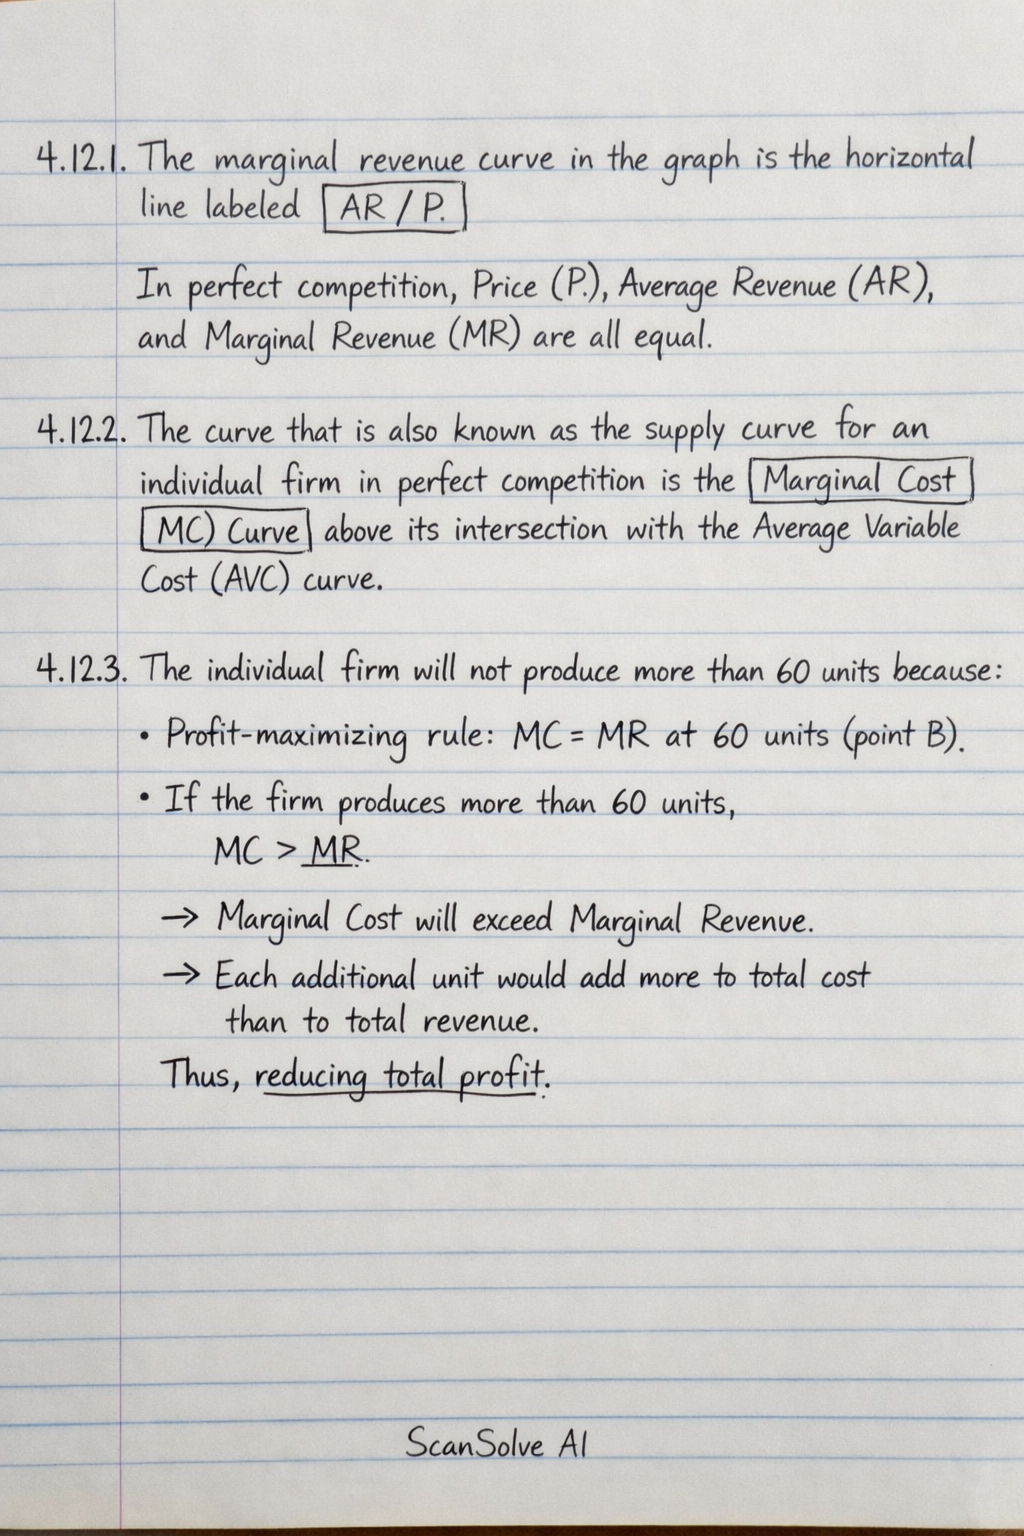
Here are the answers to your questions based on the provided graphs: 4.12. Study the graph above and answer the questions that follow. 4.12.1. The marginal revenue curve in the graph above is the horizontal line labeled AR/P. In perfect competition, Price (P), Average Revenue (AR), and Marginal Revenue (MR) are all equal. 4.12.2. The curve that is also known as the supply curve for an individual firm in perfect competition is the Marginal Cost (MC) curve above its intersection with the Average Variable Cost (AVC) curve. 4.12.3. The individual firm will not produce more than 60 units because the profit-maximising rule is to produce where Marginal Cost (MC) equals Marginal Revenue (MR). At 60 units, MC = MR (at point B). If the firm produces more than 60 units, its Marginal Cost will exceed its Marginal Revenue (MC > MR), meaning each additional unit produced would add more to total cost than to total revenue, thus reducing total profit. 4.12.4. • The market demand curve for the entire industry is downward sloping, reflecting the law of demand where quantity demanded increases as price falls. • The demand curve of the individual firm in perfect competition is perfectly elastic (a horizontal line at the market price). This is because the individual firm is a price taker and can sell any quantity at the prevailing market price without affecting it. 4.12.5. Point A is the shutdown point. It represents the minimum point of the Average Variable Cost (AVC) curve, where MC = AVC. If the market price falls below this point, the firm cannot even cover its variable costs and should shut down production in the short run to minimize losses. 4.13. Study the graph below and answer the questions that follow. 4.13.1. The quantity of goods that will be produced by the individual firm is Q_2. Reason: A firm in perfect competition maximizes its profit (or minimizes its loss) by producing at the output level where its Marginal Cost (MC) equals its Marginal Revenue (MR). In the graph, the MC curve intersects the MR curve at point A, which corresponds to the quantity Q2.