
We read your photo as:
The above table represents a consumer buying two goods, Pizza and Milk shakes. The price of a Pizza is 2.00 per unit and a Milkshake is 1.00 per unit. The consumer's income is $8.00 and is all spent. Answer the following questions.
ScanSolve AI Answer
Step-by-step solution
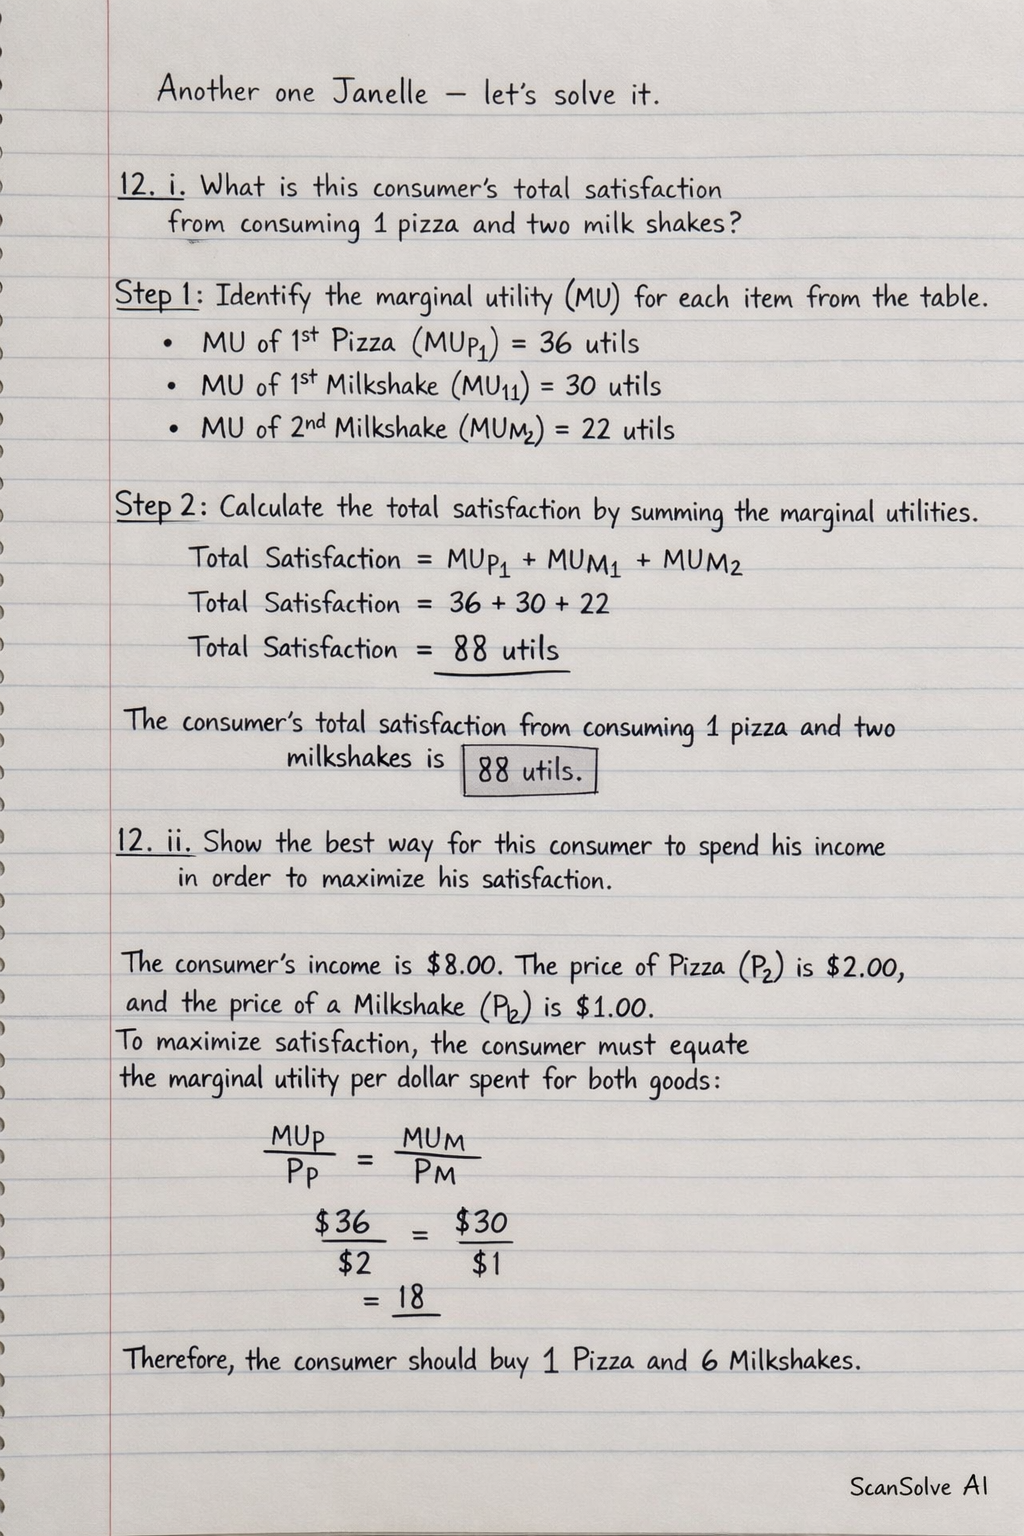
11 steps12. i. What is this consumer's total satisfaction from consuming 1 pizza and two milk shakes?
Identify the marginal utility (MU) for each item from the table.
- MU of 1st Pizza () = 36 utils
- MU of 1st Milkshake () = 30 utils
- MU of 2nd Milkshake () = 22 utils
Calculate the total satisfaction by summing the marginal utilities.
The consumer's total satisfaction from consuming 1 pizza and two milkshakes is .
12. ii. Show the best way for this consumer to spend his income in order to maximize his satisfaction.
The consumer's income is P_P2.00, and the price of a Milkshake () is MU_P/P_P = MU_M/P_M$) and spend all income.
Calculate for each unit of Pizza and Milkshake.
Quantity (Q) MU Pizza () MU Milkshake () 1 36 18 30 30 2 24 12 22 22 3 20 10 16 16 4 18 9 12 12 5 16 8 10 10 6 10 5 4 4 Allocate income by choosing the good with the highest until all income is spent and .
- 1st unit: Milkshake (30 utils/1.00. Remaining income: $7.00. (Qp=0, Qm=1)
- 2nd unit: Pizza (18 utils/2.00. Remaining income: $5.00. (Qp=1, Qm=1)
- 3rd unit: Milkshake (22 utils/1.00. Remaining income: $4.00. (Qp=1, Qm=2)
- 4th unit: Milkshake (16 utils/1.00. Remaining income: $3.00. (Qp=1, Qm=3)
- 5th unit: Pizza (12 utils/2.00. Remaining income: $1.00. (Qp=2, Qm=3)
- 6th unit: Milkshake (12 utils/1.00. Remaining income: $0.00. (Qp=2, Qm=4)
At this point, the consumer has purchased 2 Pizzas and 4 Milkshakes.
Total cost =(2 \times \2.00) + (4 \times $1.00) = $4.00 + $4.00 = $8.00MU/PMU/PMU_P/P_P = MU_M/P_M = 12$ is met.The best way for this consumer to spend his income is to purchase .
12. iii. What will be his total satisfaction in utils?
Sum the marginal utilities for the optimal consumption bundle (2 Pizzas and 4 Milkshakes).
- Total Utility from 2 Pizzas = utils
- Total Utility from 4 Milkshakes = utils
Calculate the total satisfaction.
His total satisfaction will be .
12. iv. State his equilibrium condition.
The consumer equilibrium condition for maximizing utility is:
And all income must be spent.
The equilibrium condition is that the .12. v. The price of both goods now cos $1.00 each. How should this consumer spend his income?
New prices: , . Income = MU_P/1 = MU_M/1MU_P = MU_MQ_P + Q_M = 81.00, 8 units can be bought).
List the marginal utilities for Pizza and Milkshake.
Quantity (Q) MU Pizza MU Milkshake 1 36 30 2 24 22 3 20 16 4 18 12 5 16 10 6 10 4 Allocate income by choosing the good with the highest MU until 8 units are purchased and .
- 1st unit: Pizza (MU=36). (Qp=1, Qm=0)
- 2nd unit: Milkshake (MU=30). (Qp=1, Qm=1)
- 3rd unit: Pizza (MU=24). (Qp=2, Qm=1)
- 4th unit: Milkshake (MU=22). (Qp=2, Qm=2)
- 5th unit: Pizza (MU=20). (Qp=3, Qm=2)
- 6th unit: Pizza (MU=18). (Qp=4, Qm=2)
- 7th unit: Milkshake (MU=16). (Qp=4, Qm=3)
- 8th unit: Pizza (MU=16). (Qp=5, Qm=3)
At this point, the consumer has purchased 5 Pizzas and 3 Milkshakes.
Total units = . Total cost =8 \times \1.00 = $8.00MU_P = MU_M = 16$ is met.The consumer should spend his income by purchasing .
12. vi. Sketch the Demand curve for Pizza.
From part ii, when
P_P = \2.00Q_PP_P = $1.00Q_P$) is 5 units.To sketch the demand curve for Pizza:
- Draw a graph with Price on the vertical (y) axis and Quantity on the horizontal (x) axis.
- Plot the first point: (Quantity = 2, Price = $2.00).
- Plot the second point: (Quantity = 5, Price = $1.00).
- Draw a downward-sloping line connecting these two points. This line represents the demand curve for Pizza.
12. vii. Is Pizza elastic or inelastic at the above price points? Explain.
To determine elasticity, we calculate the price elasticity of demand (PED) using the midpoint formula.
- Initial Price () = Q_1$) = 2
- New Price () = Q_2$) = 5
Calculate the percentage change in quantity demanded.
Calculate the percentage change in price.
Calculate the Price Elasticity of Demand (PED).
Since , Pizza is . This means that a percentage change in price leads to a larger percentage change in quantity demanded.
Still stuck on this one?
Ask a follow-up, and the answer starts from this question.
More Economics Questions
Handwritten Step-by-Step Solution
Get this as a handwritten image on WhatsApp — like a tutor wrote it for you.
Try on WhatsApp