
We read your photo as:
The image contains a partial case study on "Public Transportation in Kingstown" and questions 13-16. Please provide the full text of the case study and the questions for 15 and 16. The solution addres
ScanSolve AI Answer
Step-by-step solution
4 stepsTo answer Questions 13 and 14, a Production Possibilities Frontier (PPF) graph showing points A and C, and the quantities of wheat and rice at those points, is required. This graph is not visible in the image provided.
Here's how you would approach these questions if the graph were available:
Part 13· 2 steps
To determine the opportunity cost of producing 1 unit of wheat at point C, you would look at the PPF.
Identify point C on the PPF, which represents a specific combination of wheat and rice production.
Determine how many units of rice must be given up to produce an additional unit of wheat when moving from point C along the PPF.
The amount of rice foregone is the opportunity cost.
Part 14· 2 steps
To determine the opportunity cost of producing rice at point A, you would look at the PPF.
Identify point A on the PPF, which represents a specific combination of wheat and rice production.
Determine how many units of wheat must be given up to produce an additional unit of rice when moving from point A along the PPF.
The amount of wheat foregone is the opportunity cost.
For Questions 15 and 16, the actual questions are not visible in the image, and only a partial case study on "Public Transportation in Kingstown" is provided. Please provide the full text of the case study and the questions for 15 and 16.
Still stuck on this one?
Ask a follow-up, and the answer starts from this question.
More Economics Questions
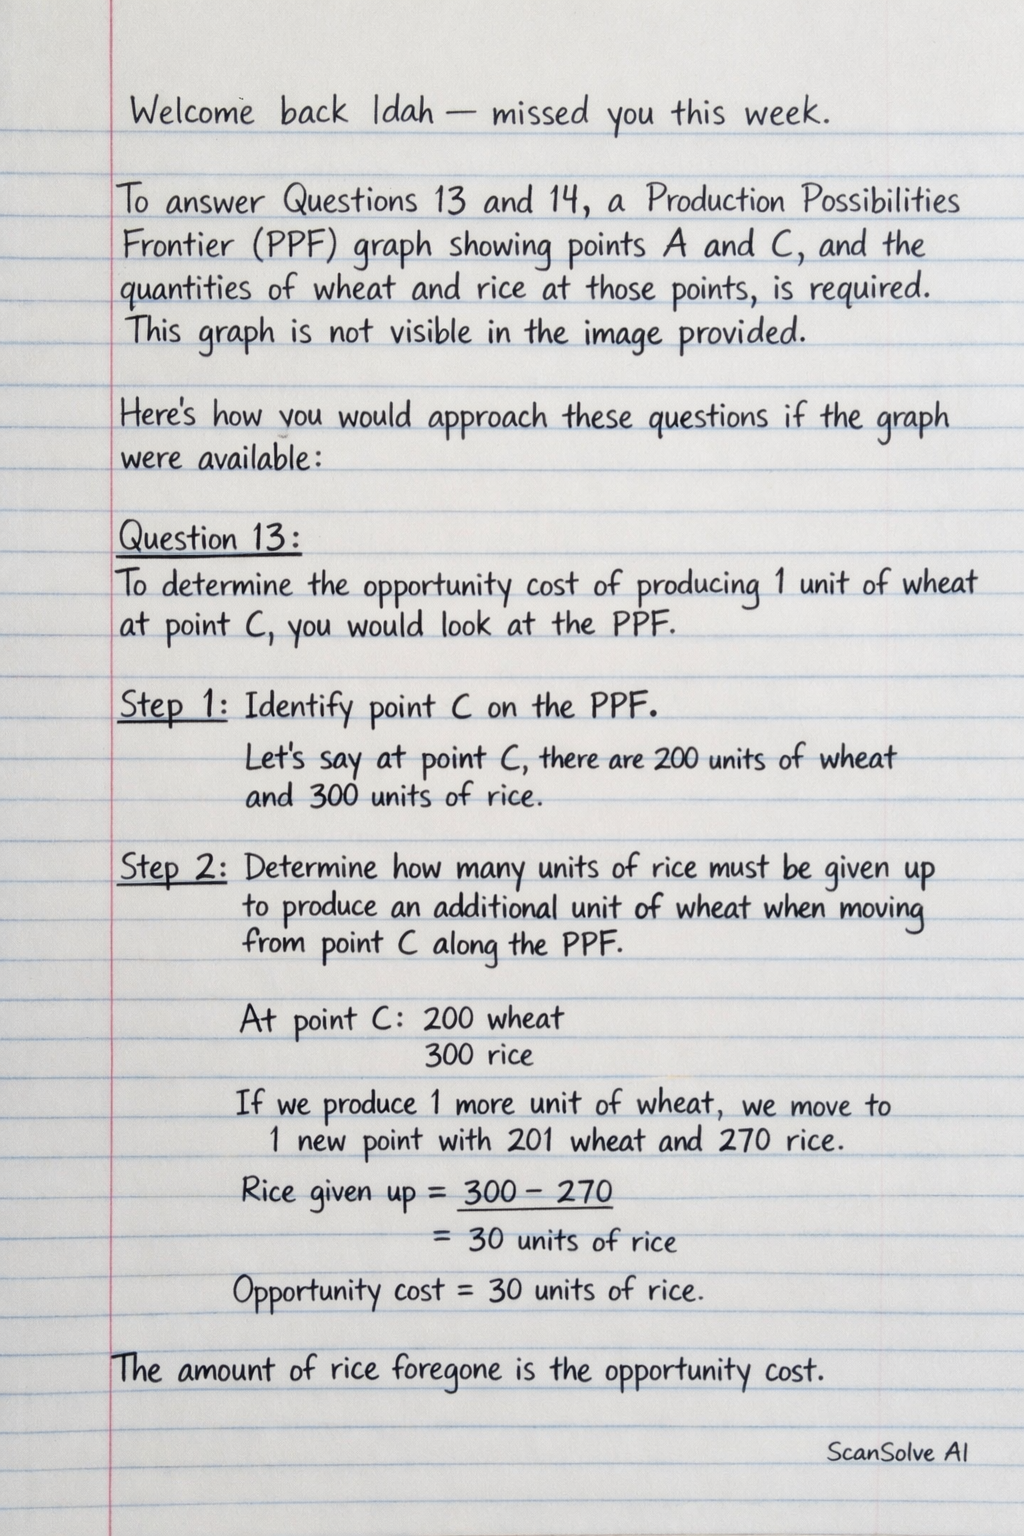
Handwritten Step-by-Step Solution
Get this as a handwritten image on WhatsApp — like a tutor wrote it for you.
Try on WhatsApp