
We read your photo as:
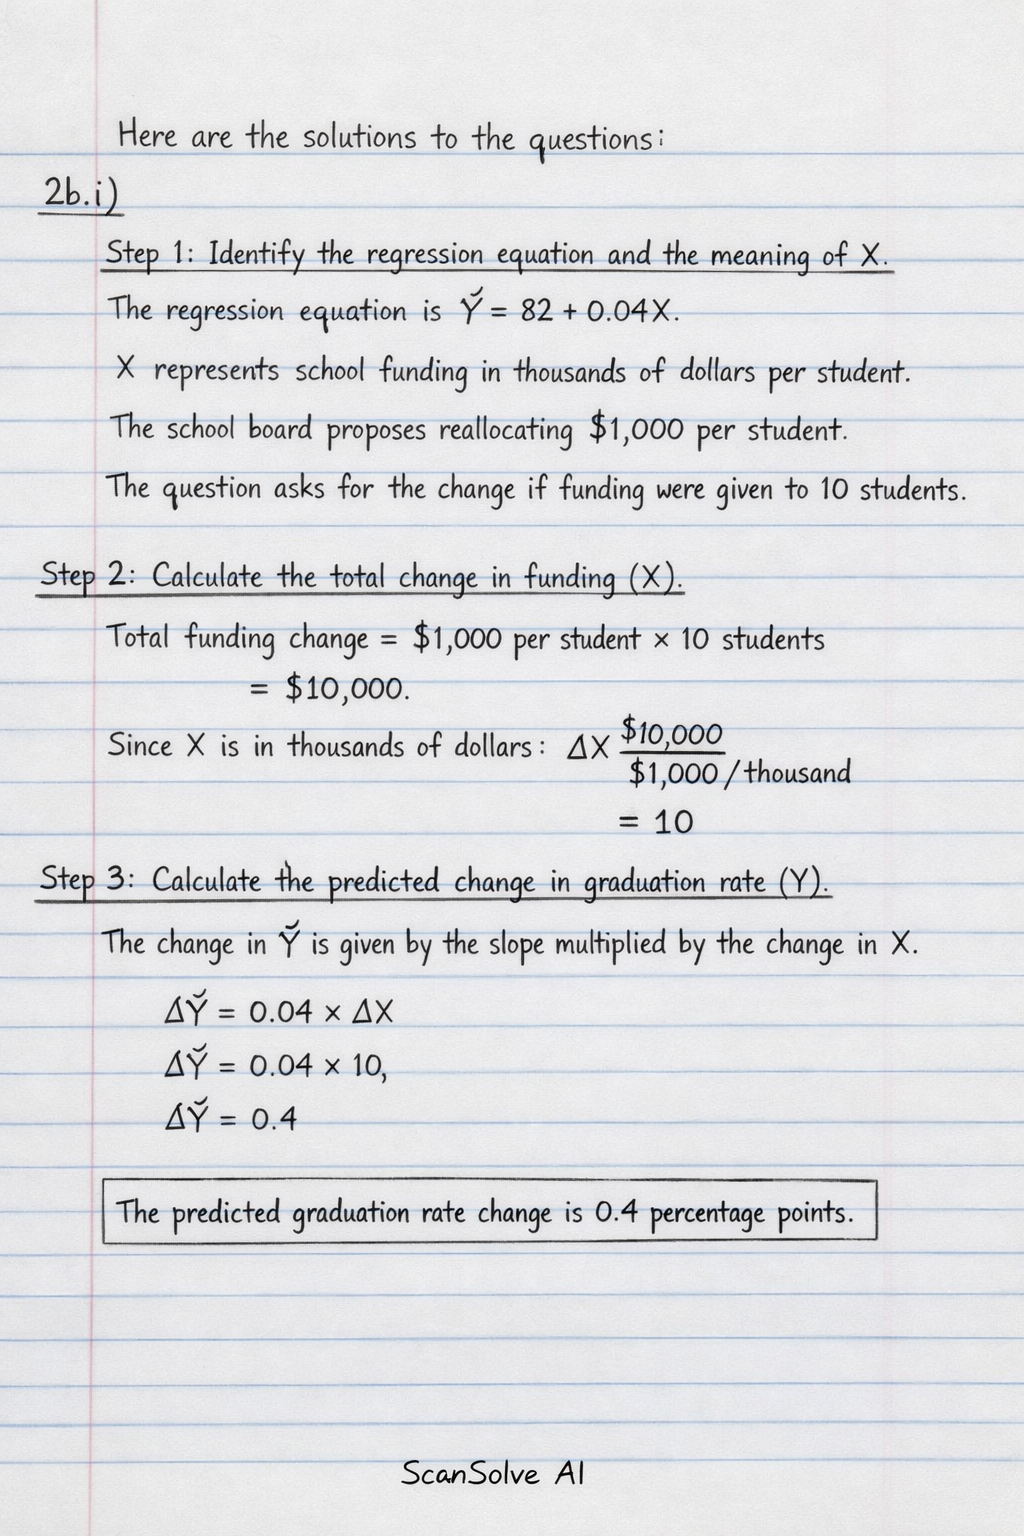
The school board is considering reallocating $1,000 per student. If this funding were given to 10 students, what would be the predicted change in the graduation rate?
ScanSolve AI Answer
Step-by-step solution
10 stepsHere are the solutions to the questions:
2b.i)
Identify the regression equation and the meaning of X.
The regression equation is .
X represents school funding in thousands of dollars per student.
The school board proposes reallocating $1,000 per student. The question asks for the change if funding were given to 10 students.Calculate the total change in funding (X).
Total funding change =
1,000 \text{ per student} \times 10 \text{ students} = \10,000\Delta X = \frac{$10,000}{$1,000/\text{thousand}} = 10$.Calculate the predicted change in graduation rate (Y).
The change in is given by the slope multiplied by the change in X.
The predicted graduation rate change is .
2b.iii)
To determine homogeneity, calculate the Coefficient of Variation (CV) for each school. A smaller CV indicates more homogeneous performance.
The formula for CV is .Calculate CV for School A.
Mean = 75, SD = 5
Calculate CV for School B.
Mean = 70, SD = 12
Compare the CV values.
Since is less than , School A has more homogeneous performance.
School A has the most homogeneous performance because its coefficient of variation is lower, indicating that its students' scores are less spread out relative to their mean score compared to School B.3a.i)
Find the Z-score corresponding to the top 10% (90th percentile) for a normal distribution.
For the top 10%, we need the score such that , which means .
Using a standard normal distribution table or calculator, the Z-score for the 90th percentile is approximately .Convert the Z-score back to a raw score using the formula .
Given and .
The score that corresponds to an A- (top 10%) is .
3a.ii)
Determine the percentage of students who would fail.
Failing is defined as the bottom 5%.
Calculate the number of students in a 100-person class.
Number of failing students = .
In a 100-person class, would theoretically fail
Still stuck on this one?
Ask a follow-up, and the answer starts from this question.
More Economics Questions
Handwritten Step-by-Step Solution
Get this as a handwritten image on WhatsApp — like a tutor wrote it for you.
Try on WhatsApp