
This English question involves literary analysis, grammar, or writing skills. The detailed response below provides a well-structured answer with supporting evidence and clear explanations.
ScanSolve AI Answer
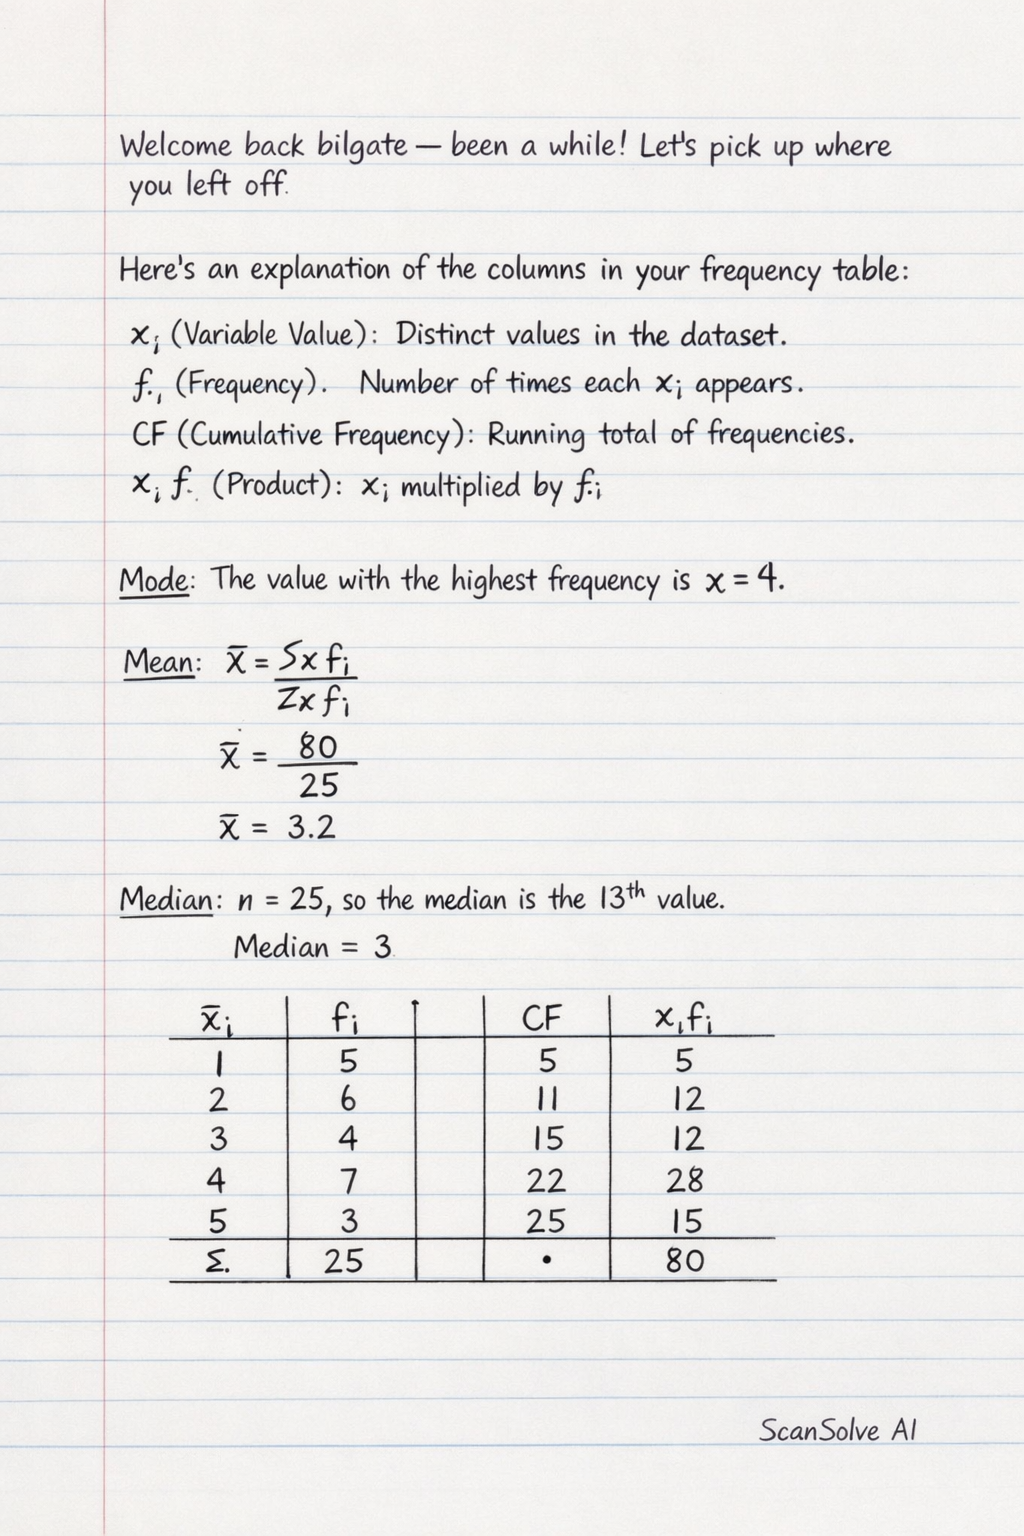
Here's an explanation of the columns in your frequency table: x_i (Variable Value): This column lists the distinct values or categories observed in your dataset. f_i (Frequency): This column shows how many times each specific x_i value appears in the dataset. CF (Cumulative Frequency): This is the running total of the frequencies. For each row, it represents the total number of observations that are less than or equal to the current x_i value. x_i f_i (Product): This column is the result of multiplying each variable value (x_i) by its corresponding frequency (f_i). The sum of this column is used to calculate the mean. Now, let's calculate the mode, mean, and median, and then present the frequency table. The data from the table is: | x_i | f_i | CF (calculated) | x_i f_i | | :---: | :---: | :-----------: | :-------: | | 2 | 2 | 2 | 4 | | 4 | 1 | 3 | 4 | | 6 | 5 | 8 | 30 | | 7 | 7 | 15 | 49 | | 9 | 3 | 18 | 27 | | 12 | 2 | 20 | 24 | | Total | 20 | | 138 | a) What is the mode? Step 1: Identify the highest frequency Looking at the f_i column, the highest frequency is 7. Step 2: Determine the corresponding x_i value The x_i value that corresponds to the frequency of 7 is 7. The mode is 7. b) Mean Step 1: Use the formula for the mean The mean (x) is calculated by dividing the sum of the products x_i f_i by the sum of the frequencies f_i. x = ( x_i f_i)/( f_i) Step 2: Substitute the sums from the table From the table: x_i f_i = 138 f_i = 20 x = (138)/(20) Step 3: Calculate the result x = 6.9 The mean is 6.9. c) Median Step 1: Determine the position of the median The total number of observations is N = f_i = 20. Since N is an even number, the median is the average of the (N)/(2)-th and ((N)/(2)+1)-th values. (N)/(2) = (20)/(2) = 10 So, we need to find the 10th and 11th values. Step 2: Use cumulative frequencies to find the corresponding values Using the calculated cumulative frequency (CF) column: The first 2 values are 2. The values from the 3rd to the 3rd are 4. The values from the 4th to the 8th are 6. The values from the 9th to the 15th are 7. Therefore, the 10th value is 7. And the 11th value is also 7. The median is the average of these two values: Median = (7+7)/(2) = 7 The median is 7. d) Draw a frequency table to show the distribution Here is the frequency table showing the distribution, with the correct cumulative frequencies: | x_i | f_i | CF | x_i f_i | | :---: | :---: | :---: | :---: | | 2 | 2 | 2 | 4 | | 4 | 1 | 3 | 4 | | 6 | 5 | 8 | 30 | | 7 | 7 | 15 | 49 | | 9 | 3 | 18 | 27 | | 12 | 2 | 20 | 24 | | Total | 20 | | 138 | What's next?