

This English question involves literary analysis, grammar, or writing skills. The detailed response below provides a well-structured answer with supporting evidence and clear explanations.
ScanSolve AI Answer
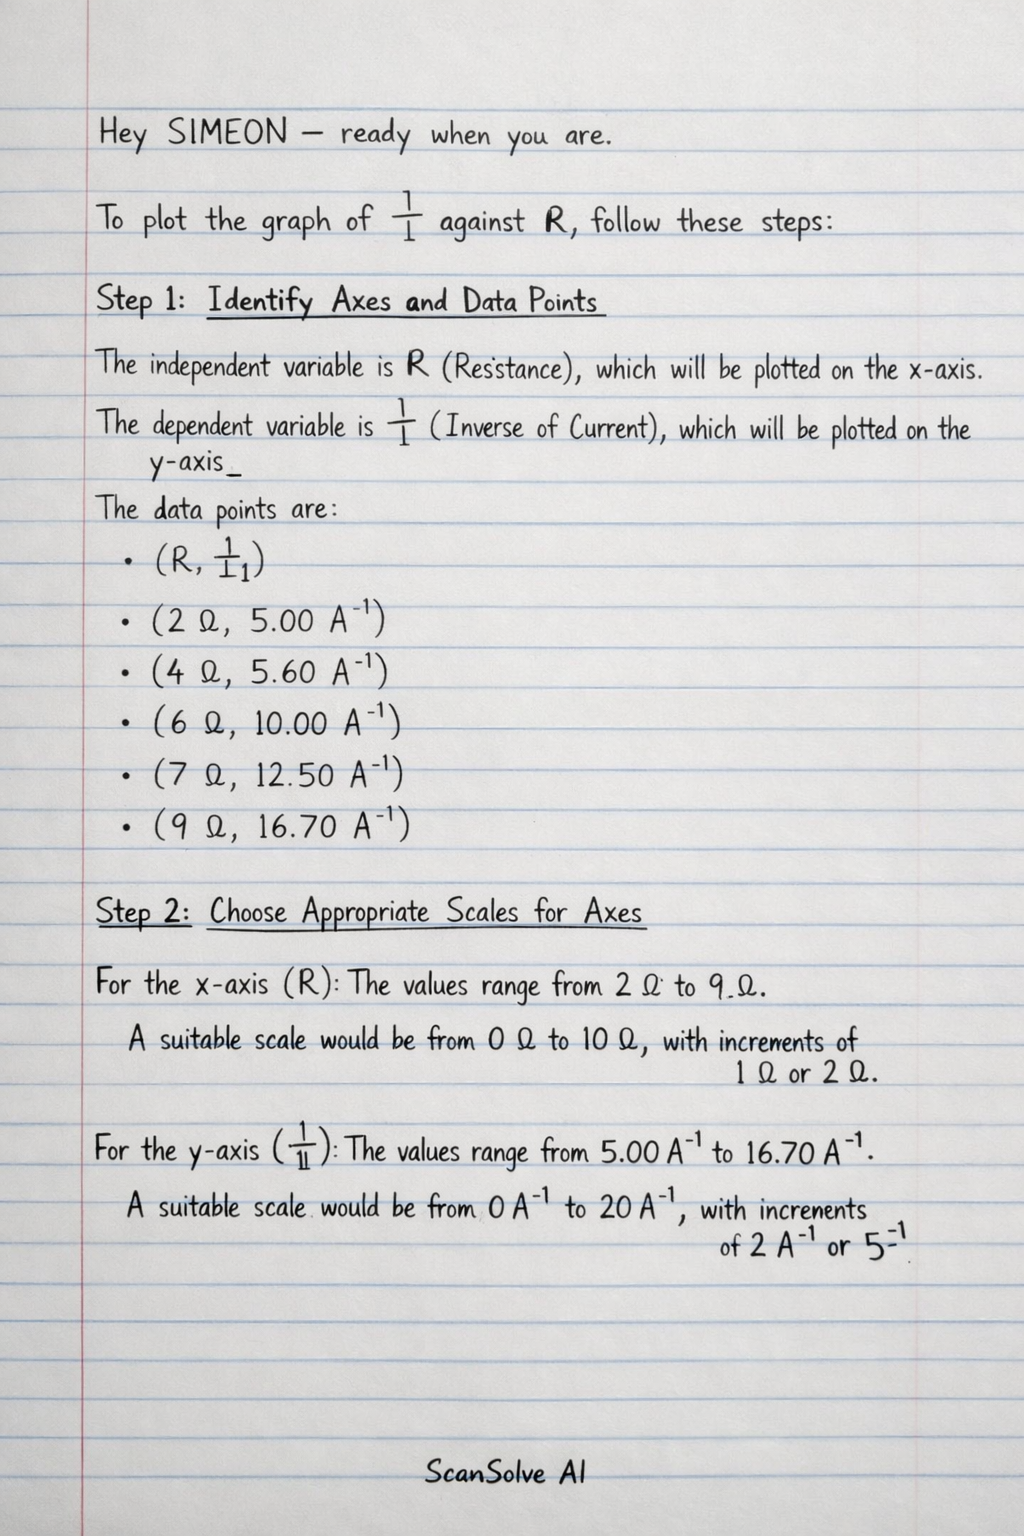
To plot the graph of (1)/(I) against R, follow these steps: Step 1: Identify Axes and Data Points The independent variable is R (Resistance), which will be plotted on the x-axis. The dependent variable is (1)/(I) (Inverse of Current), which will be plotted on the y-axis. The data points are: • (R, (1)/(I)) • (2 \, , 5.00 \, A^-1) • (4 \, , 5.60 \, A^-1) • (6 \, , 10.00 \, A^-1) • (7 \, , 12.50 \, A^-1) • (9 \, , 16.70 \, A^-1) Step 2: Choose Appropriate Scales for Axes For the x-axis (R): The values range from 2 \, to 9 \, . A suitable scale would be from 0 \, to 10 \, , with increments of 1 \, or 2 \, . For the y-axis ((1)/(I)): The values range from 5.00 \, A^-1 to 16.70 \, A^-1. A suitable scale would be from 0 \, A^-1 to 20 \, A^-1, with increments of 2 \, A^-1 or 5 \, A^-1. Step 3: Label Axes Label the x-axis as "R \, ()" and the y-axis as "(1)/(I) \, (A^-1)". Include the units. Step 4: Plot the Data Points Carefully mark each of the five data points on your graph paper according to their (R, (1)/(I)) coordinates. Step 5: Draw the Line of Best Fit Since the relationship between (1)/(I) and R for a cell with internal resistance is linear ((1)/(I) = (1)/(E)R + (r)/(E) where E is EMF and r is internal resistance), draw a straight line that best fits through the plotted points. This line should pass as close as possible to all points, with roughly an equal number of points above and below the line. Extend the line to intersect both axes if possible. The resulting graph will be a straight line with a positive slope. Send me the next one 📸