
This physics problem tests your understanding of fundamental physical laws and their applications. The step-by-step solution below breaks down the problem using relevant equations and physical reasoning.
ScanSolve AI Answer
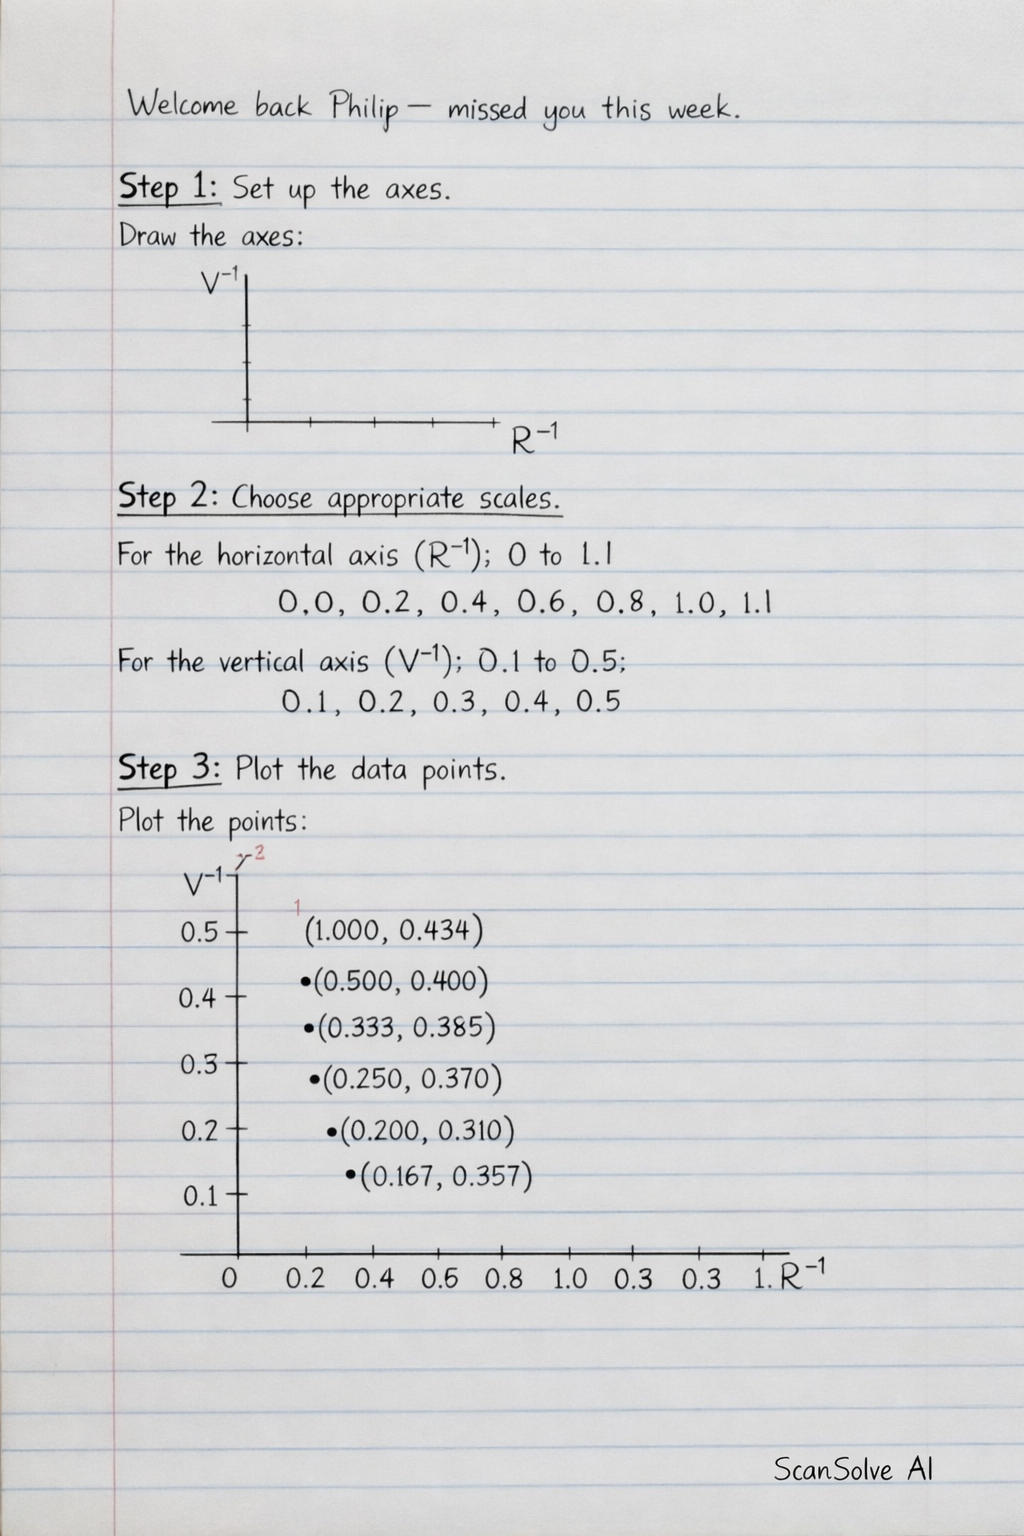
To plot the graph of V^-1 on the vertical axis against R^-1 on the horizontal axis, follow these steps: Step 1: Set up the axes. Draw two perpendicular axes on graph paper. Label the horizontal axis as R^-1 and the vertical axis as V^-1. Include appropriate units if they were provided (though none are given here). Step 2: Choose appropriate scales. For the horizontal axis (R^-1), the values range from 0.167 to 1.000. A suitable scale would be from 0 to 1.1, with major grid lines at intervals like 0.1 or 0.2. For the vertical axis (V^-1), the values range from 0.310 to 0.434. A suitable scale would be from 0.1 to 0.5, with major grid lines at intervals like 0.05 or 0.1. Step 3: Plot the data points. Plot each pair of (R^-1, V^-1) values on the graph. • (1.000, 0.434) • (0.500, 0.400) • (0.333, 0.385) • (0.250, 0.370) • (0.200, 0.310) • (0.167, 0.357) Step 4: Draw the line of best fit. Using a ruler, draw a straight line that best represents the trend of the plotted points. This line should pass as close as possible to all points, with roughly an equal number of points above and below the line. Send me the next one 📸