
We read your photo as:
Complete the table and plot a graph of T2 against l for a simple pendulum experiment.
ScanSolve AI Answer
Answers
2 partsStep-by-step solution
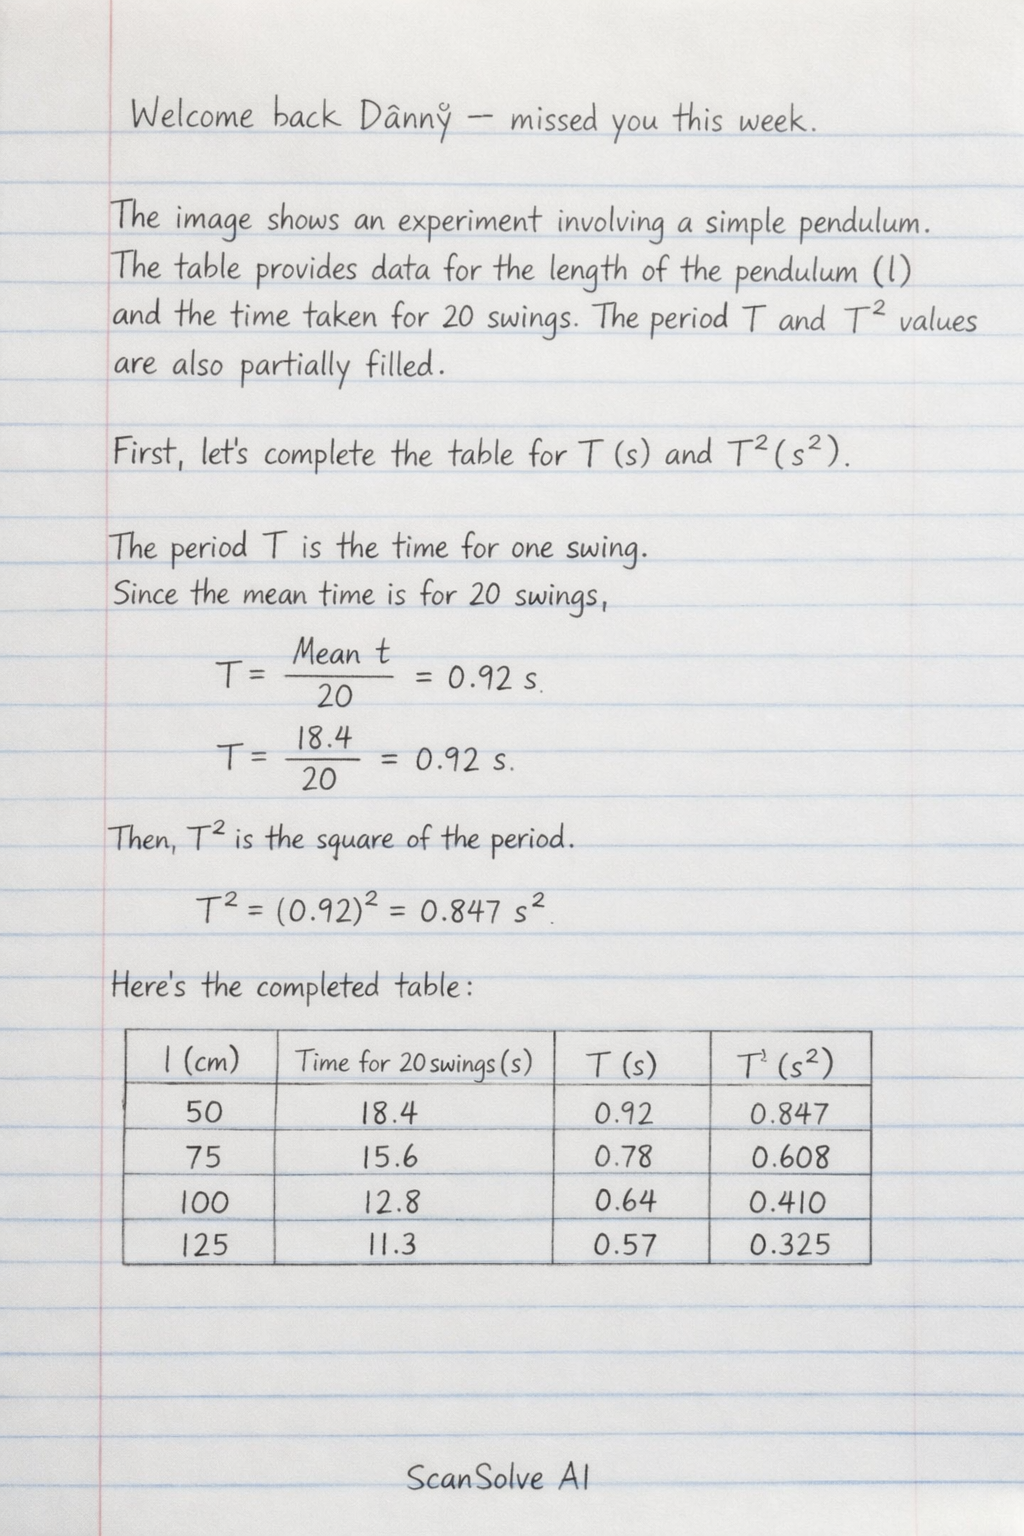
3 stepsThe image shows an experiment involving a simple pendulum. The table provides data for the length of the pendulum () and the time taken for 20 swings. The period and values are also partially filled.
First, let's complete the table for and .
The period is the time for one swing. Since the mean time is for 20 swings, .
Then, is the square of the period.
Here's the completed table:
| (cm) | (m) | (s) | (s) | Mean (s) | (s) = Mean /20 | (s) |
|---|---|---|---|---|---|---|
| 100 | 1.00 | 40.33 | 40.06 | 40.19 | 2.0095 | 4.038 |
| 90 | 0.90 | 38.00 | 38.10 | 38.05 | 1.9025 | 3.620 |
| 80 | 0.80 | 36.00 | 36.10 | 36.05 | 1.8025 | 3.249 |
| 70 | 0.70 | 34.00 | 33.90 | 33.95 | 1.6975 | 2.881 |
| 60 | 0.60 | 31.00 | 31.00 | 31.00 | 1.5500 | 2.403 |
| 50 | 0.50 | 29.00 | 28.60 | 28.80 | 1.4400 | 2.074 |
Part a
Plot a graph against in meters.
This step requires plotting on graph paper, which cannot be done here. However, I can provide the data points for plotting.
The points to plot are :
Part b
Find the slope of the graph.
The formula for the period of a simple pendulum is .
Squaring both sides gives .
This equation is in the form , where , , and the slope .
To find the slope, we can use two points from the calculated data. Let's use the first and last points for better accuracy.
Point 1:
Point 2:
Calculate the slope .
The slope of the graph is .
Part c
Calculate the value of .
From the relationship , we can find .
Rearrange the formula to solve for .
Substitute the value of the slope .
The value of is .
Try one yourself
A new problem that tests the same skill.
Still stuck on this one?
Ask a follow-up, and the answer starts from this question.
More Physics Questions
Handwritten Step-by-Step Solution
Get this as a handwritten image on WhatsApp — like a tutor wrote it for you.
Try on WhatsApp