
This physics problem tests your understanding of fundamental physical laws and their applications. The step-by-step solution below breaks down the problem using relevant equations and physical reasoning.
ScanSolve AI Answer
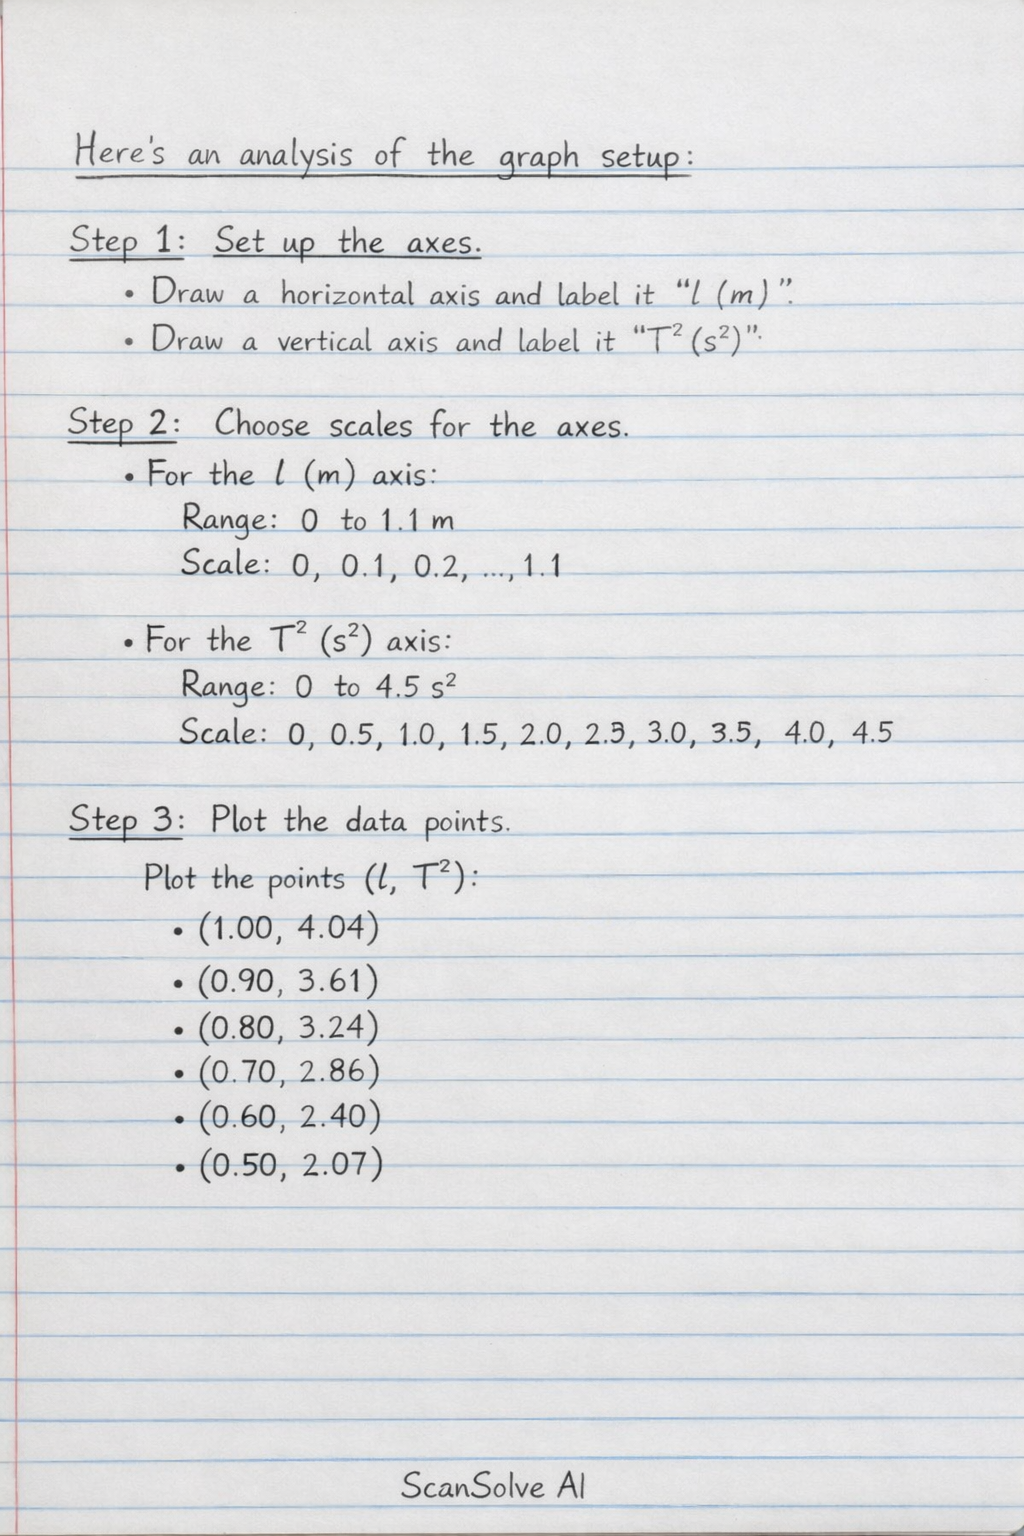
You're on a roll — I cannot directly draw a graph diagram in this format, but I can provide detailed instructions on how to plot it using the given data and describe its expected appearance. Step 1: Set up the axes. Draw a horizontal axis (x-axis) and label it "l (m)". Draw a vertical axis (y-axis) and label it "T^2 (s^2)". Step 2: Choose appropriate scales for the axes. For the l (m) axis: The values range from 0.50 m to 1.00 m. A suitable scale would be from 0 m to 1.1 m, with major grid lines every 0.1 m. For the T^2 (s^2) axis: The values range from 2.07 s^2 to 4.04 s^2. A suitable scale would be from 0 s^2 to 4.5 s^2, with major grid lines every 0.5 s^2. Step 3: Plot the data points. Plot the following (l, T^2) coordinate pairs on your graph paper: (1.00, 4.04) (0.90, 3.61) (0.80, 3.24) (0.70, 2.86) (0.60, 2.40) (0.50, 2.07) Step 4: Draw the line of best fit. Once all points are plotted, draw a single straight line that passes as close as possible to all the points. This line represents the best-fit line for the data. It should pass through or very close to the origin (0,0) if the relationship T^2 l holds true. Expected appearance of the graph: The graph of T^2 against l should be a straight line passing through the origin (or very close to it), indicating a direct proportionality between T^2 and l. The slope of this line will be (4^2)/(g), where g is the acceleration due to gravity. What's next?