
We read your photo as:
Complete the data table, list coordinates for plotting T2 vs l, and describe how to plot the graph.
Physics
ScanSolve AI Answer
Step-by-step solution
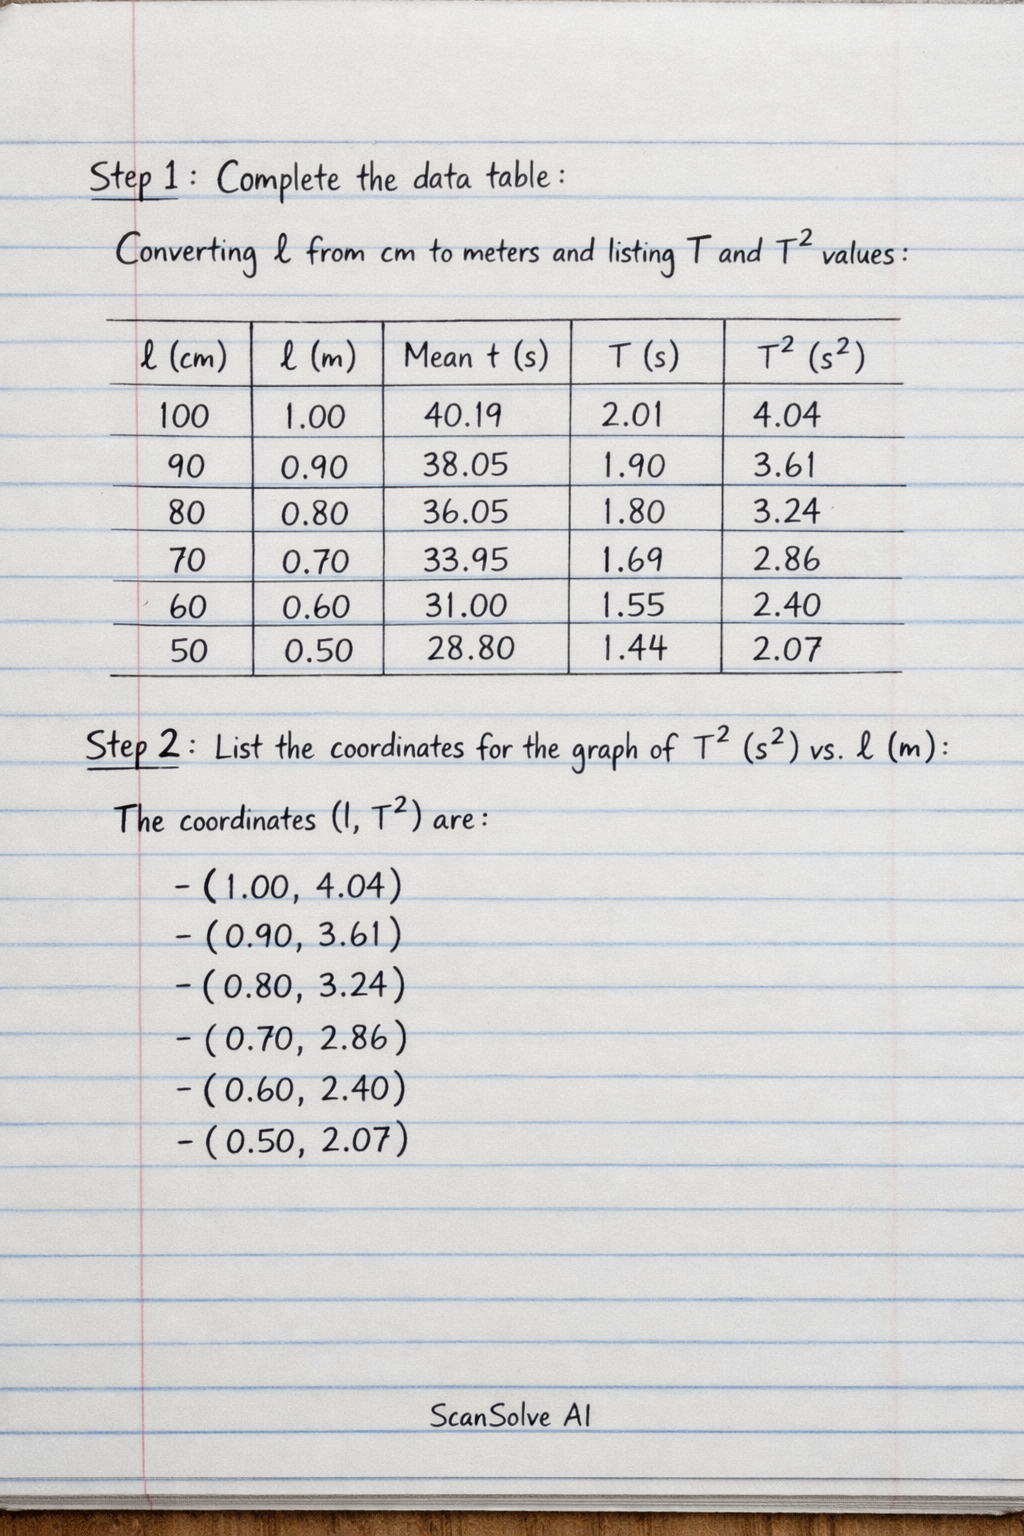
2 stepsComplete the data table by converting from cm to meters and listing the calculated and values from the provided table.
The completed data table is:
(cm) (m) Mean (s) (s) (s) 100 1.00 40.19 2.01 4.04 90 0.90 38.05 1.90 3.61 80 0.80 36.05 1.80 3.24 70 0.70 33.95 1.69 2.86 60 0.60 31.00 1.55 2.40 50 0.50 28.80 1.44 2.07 List the coordinates for plotting the graph of (s) against (m).
The coordinates are:
To plot the graph:
- Draw a horizontal axis for (m).
- Draw a vertical axis for (s).
- Choose appropriate scales for both axes to accommodate the range of values.
- Plot each of the coordinate points listed above.
- Draw the best-fit line through the plotted points.
Was this helpful?
Still stuck on this one?
Ask a follow-up, and the answer starts from this question.
Got a different question?Ask your own question
More Physics Questions
QPlot a graph of T2 against l using the following data points: (1.00, 4.04), (0.90, 3.61), (0.80…QComplete the table and plot a graph of T2 against l for a simple pendulum experiment.QExplain why digital stopwatches are preferred and describe how to plot and calculate the gradient of…QPlot a graph of M on the vertical axis and T 2 on the horizontal axis, starting both axes from the…QComplete the table by calculating mean t, T, T², and L³.
Handwritten Step-by-Step Solution
Get this as a handwritten image on WhatsApp — like a tutor wrote it for you.
Try on WhatsApp