
This English question involves literary analysis, grammar, or writing skills. The detailed response below provides a well-structured answer with supporting evidence and clear explanations.
ScanSolve AI Answer
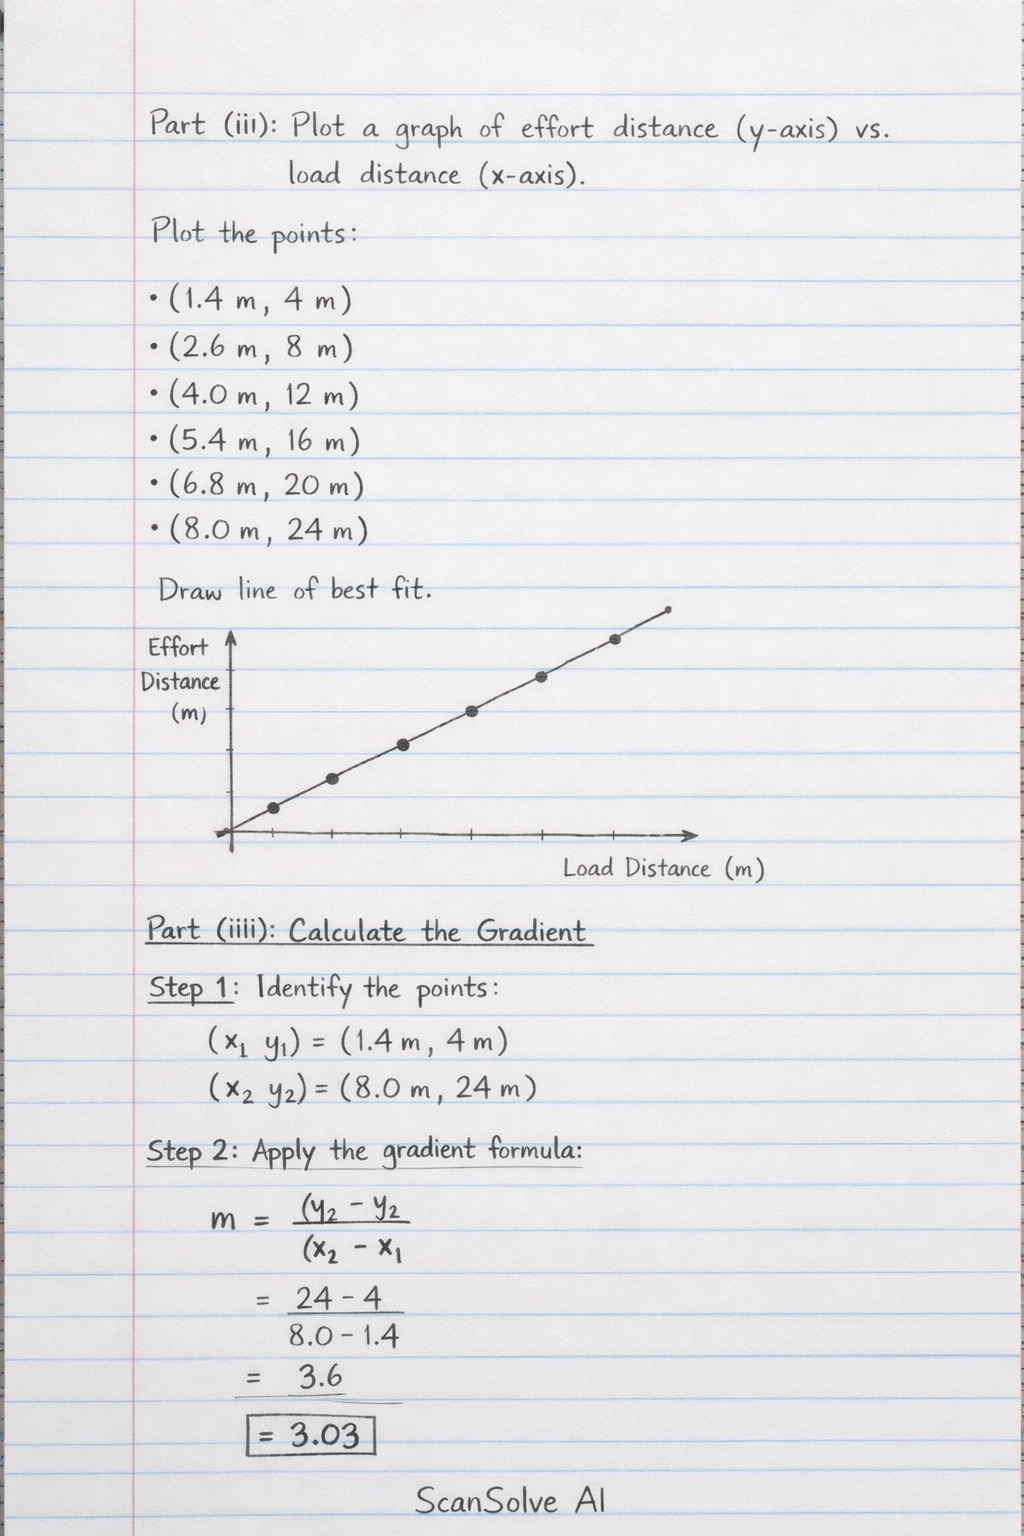
Here are the steps to solve the problem: Part (ii): Plot a graph of effort distance (y-axis) against load distance (x-axis). To plot the graph, you should use the following data points: • (Load distance, Effort distance) • (1.4 m ; 4 m) • (2.6 m ; 8 m) • (4.0 m ; 12 m) • (5.4 m ; 16 m) • (6.8 m ; 20 m) • (8.0 m ; 24 m) Plot the load distance on the x-axis and the effort distance on the y-axis. The points should form a straight or nearly straight line. Draw the line of best fit through these points. Part (iii): Calculate the gradient of the graph. To calculate the gradient, we use the formula m = ( y)/( x). We will use the first and last points to get a representative value for the gradient of the line of best fit. Step 1: Identify the points. Let (x_1, y_1) = (1.4 m ; 4 m) and (x_2, y_2) = (8.0 m ; 24 m). Step 2: Apply the gradient formula. m = (y_2 - y_1)/(x_2 - x_1) Step 3: Substitute the values and calculate. m = 24 m - 4 m8.0 m - 1.4 m m = 20 m6.6 m m ≈ 3.03 The gradient is a dimensionless quantity. The gradient of the graph is 3.03. Part (iv): What is the significance of the gradient? The gradient of the graph, which represents the ratio of the distance moved by the effort to the distance moved by the load (effort distanceload distance), is known as the velocity ratio (or displacement ratio) of the pulley system. It indicates how many times the effort distance is greater than the load distance. That's 2 down. 3 left today — send the next one.