
This English question involves literary analysis, grammar, or writing skills. The detailed response below provides a well-structured answer with supporting evidence and clear explanations.
ScanSolve AI Answer
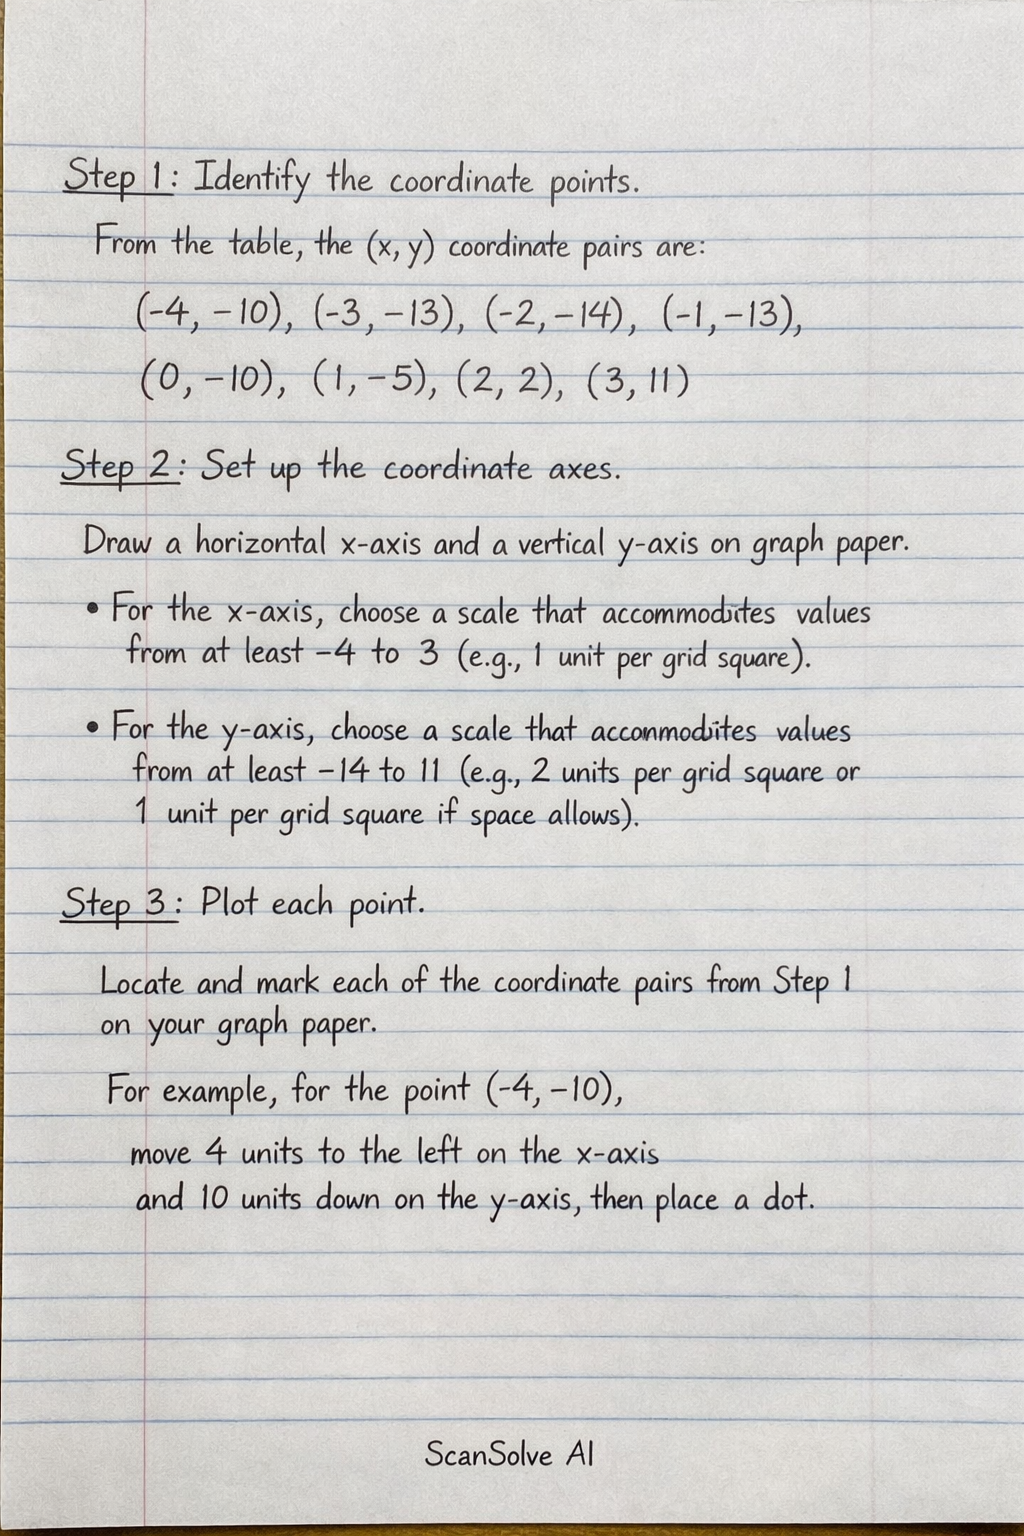
To plot the graph for the equation y = x^2 + 4x - 10 using the given table of values, follow these steps: Step 1: Identify the coordinate points. From the table, the (x, y) coordinate pairs are: (-4, -10), (-3, -13), (-2, -14), (-1, -13), (0, -10), (1, -5), (2, 2), (3, 11) Step 2: Set up the coordinate axes. Draw a horizontal x-axis and a vertical y-axis on a graph paper. • For the x-axis, choose a scale that accommodates values from at least -4 to 3 (e.g., 1 unit per grid square). • For the y-axis, choose a scale that accommodates values from at least -14 to 11 (e.g., 2 units per grid square or 1 unit per grid square if space allows). Step 3: Plot each point. Locate and mark each of the coordinate pairs from Step 1 on your graph paper. For example, for the point (-4, -10), move 4 units to the left on the x-axis and 10 units down on the y-axis, then place a dot. Step 4: Draw the curve. Once all points are plotted, draw a smooth curve that passes through all the plotted points. Since this is a quadratic equation (y = x^2 + 4x - 10), the graph will be a parabola. The points to plot are: (-4, -10), (-3, -13), (-2, -14), (-1, -13), (0, -10), (1, -5), (2, 2), (3, 11) Send me the next one 📸