
We read your photo as:
Analyze the provided synoptic weather map and answer the following questions regarding pressure systems, fronts, and weather changes.
Geography
ScanSolve AI Answer
Here are the answers to question 1.1:
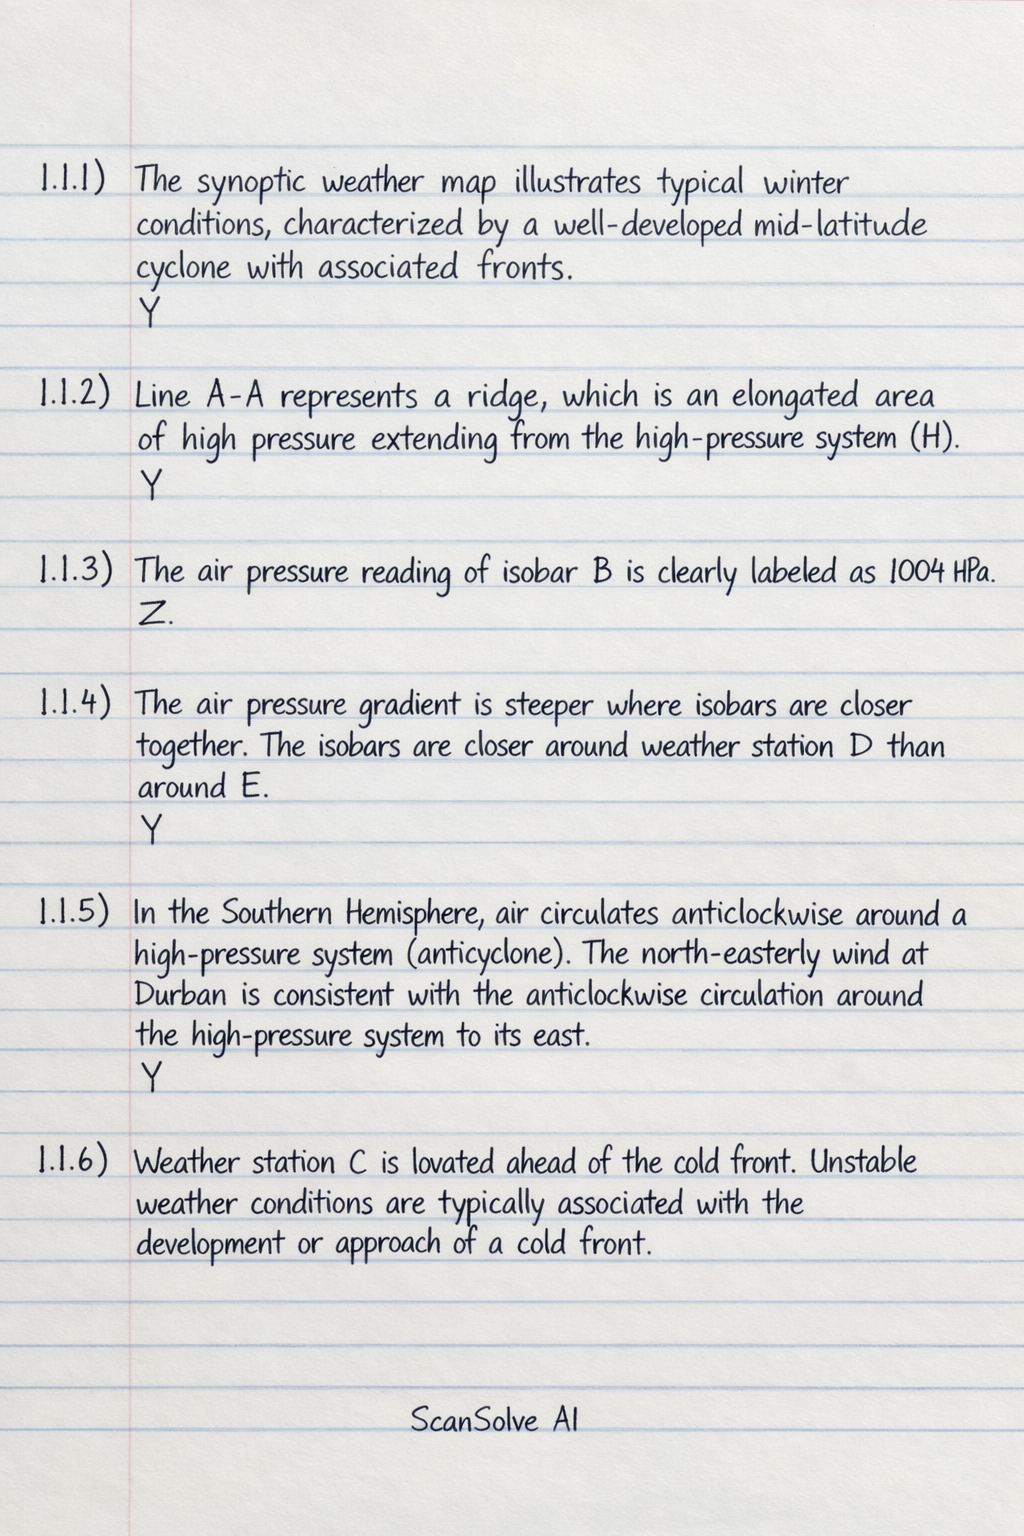
- 1.1.1: The synoptic weather map illustrates typical winter conditions, characterized by a well-developed mid-latitude cyclone with associated fronts.
- Y
- 1.1.2: Line A-A represents a ridge, which is an elongated area of high pressure extending from the high-pressure system (H).
- Y
- 1.1.3: The air pressure reading of isobar B is clearly labeled as 1004 hPa.
- Z
- 1.1.4: The air pressure gradient is steeper where isobars are closer together. The isobars are closer around weather station D than around E.
- Y
- 1.1.5: In the Southern Hemisphere, air circulates anticlockwise around a high-pressure system (anticyclone). The north-easterly wind at Durban is consistent with the anticlockwise circulation around the high-pressure system to its east.
- Y
- 1.1.6: Weather station C is located ahead of the cold front. Unstable weather conditions are typically associated with the development or approach of a cold front.
- Y
- 1.1.7: The weather changes described are a wind shift to south-west and an air temperature decrease of 5 °C.
- Option Y shows a temperature decrease of .
- Option Z shows a temperature decrease of .
- Both show a wind shift to south-west. Option Z's temperature decrease (6 °C) is closer to the stated 5 °C than option Y's (18 °C).
- Z
Was this helpful?
Still stuck on this one?
Ask a follow-up, and the answer starts from this question.
Got a different question?Ask your own question
More Geography Questions
QStudy the synoptic weather map and answer questions that follow: Name the lines joining all places…QAnalyze the provided weather map, answering specific questions about provincial weather, clothing…QAnalyze the provided weather map, answering questions about provincial weather, clothing choices…QStudy the diagram based on anticyclones and answer the questions that follow. Choose the correct…QWhat are the answers to these meteorology questions about cloud formation, temperature inversions…
Handwritten Step-by-Step Solution
Get this as a handwritten image on WhatsApp — like a tutor wrote it for you.
Try on WhatsApp