Frequency Measures - The Vital Signs of Population Health: Multiple-Choice Questions 1. What does prevalence measure? a) The number of new cases of a disease that develop over a specific period. b) The proportion of a population that has a disease at a specific point in time. c) The speed at which new cases of a disease are occurring in a population. d) The reduction in risk of a disease among those exposed to a protective factor. 2. The incidence rate of a disease is best defined as: a) The number of new cases divided by the at-risk population at the start of the study period. b) The total number of cases (new and existing) divided by the total population. c) The number of new cases occurring in a specified population, divided by the sum of person-time at risk. d) The number of existing cases in a population at a single point in time. 3. The fundamental relationship between incidence (I), prevalence (P), and the average duration of a disease (D) is best described by the formula: a) P = I / D b) P = I + D c) P = I × D d) I = P × D 4. A public health official wants to measure the overall burden of chronic diabetes in a city on January 1st. Which frequency measure is most appropriate for this purpose? a) Incidence Rate b) Cumulative Incidence c) Point Prevalence d) Crude Mortality Rate 5. Why might an epidemiologist calculate an age-specific mortality rate instead of a crude mortality rate for a country? a) It is always a smaller number and easier to interpret. b) It accounts for the fact that mortality risk is not uniform across all age groups. c) It only includes deaths from new, emerging diseases. d) It requires a smaller sample size for calculation. 6. When calculating the incidence of chickenpox in a primary school during the fall semester, what is the most appropriate denominator? a) The total number of students and teachers enrolled in the school. b) The number of students who have never had chickenpox before the semester started. c) The number of students who were absent for any reason during the semester. d) The total number of students in the entire school district. 7. In a rural village of 2,000 people, a survey conducted on May 1st finds that 100 people have active hypertension. What is the point prevalence of hypertension in this village on that date? a) 100 / 1900 b) 100 / 2000 c) 100 / 2100 d) 1 / 20 8. A cohort of 500 healthy adults is followed for two years to study a new respiratory infection. At the start of the study, no one is infected. By the end of the two years, 50 have developed the infection. What is the cumulative incidence (risk) over the two-year period? a) 50 / 500 b) 50 / 450 c) 2 / 500 d) 500 / 50 9. A new antiretroviral therapy (ART) for HIV is introduced that dramatically increases the lifespan of infected patients but does not prevent new infections. Assuming the incidence of new HIV infections in a population remains constant, what is the likely effect on the prevalence of HIV over time? a) Prevalence will decrease. b) Prevalence will remain the same. c) Prevalence will increase. d) Prevalence will fluctuate randomly. 10. A small study follows 4 individuals to monitor for the development of a specific disease. Person A was followed for 3 years and remained disease-free. Person B was followed for 5 years and remained disease-free. Person C developed the disease after 4 years of follow-up. Person D developed the disease after 2 years of follow-up. What is the incidence rate of the disease in this study? a) 2 cases / 4 people b) 2 cases / 14 person-yrs c) 2 cases / 9 person-years d) 4 cases / 14 person-yrs Measures of Association Relative risk (RR) greater than 1 indicates: a) No association between exposure and disease b) Lower risk of disease in the exposed group c) Higher risk of disease in the exposed group d) That exposure is protective Which measure describes the number of new cases of a disease occurring in a specific time period? a) Prevalence b) Incidence rate c) Case fatality rate d) Mortality rate If 500 new cases of HIV were reported in a population of 100,000 over one year, what is the incidence rate per 1,000 people? a) 0.5 b) 5 c) 50 d) 500 The odds ratio (OR) is used to: a) Compare two means b) Measure the strength of association between two categorical variables c) Test if a sample follows a chi-square distribution d) Determine the difference between two proportions The relative risk (RR) is defined as: a) The probability of an event occurring in the exposed group divided by the probability of it occurring in the non-exposed group b) The square root of the chi-square statistic c) The ratio of expected to observed frequencies d) The total variance in the dataset Linear Correlation Coefficient (r) and Covariance: 1. What is the possible range of values for the linear correlation coefficient, r? a) -∞ to + b) 0 to 1 c) -1 to 1 d) -100 to 100 2. If the covariance between two variables, X and Y, is zero, what does this indicate? a) There is a perfect negative linear relationship between X and Y. b) There is a perfect positive linear relationship between X and Y. c) There is no linear relationship between X and Y. d) The means of X and Y are equal. 3. Which of the following is the primary advantage of the correlation coefficient (r) over the covariance? a) Covariance is more difficult to calculate. b) The correlation coefficient (r) is a unitless measure, allowing for comparison between different variables. c) Covariance can only be used for normally distributed data. d) The correlation coefficient (r) can be used for non-linear relationships. 4. A study finds a correlation of r = -0.75 between weekly exercise hours and systolic blood pressure. How should this be interpreted? a) As exercise hours increase, systolic blood pressure tends to increase. b) As exercise hours increase, systolic blood pressure tends to decrease. c) There is no relationship between exercise and blood pressure. d) Exercise causes a decrease in systolic blood pressure. 5. A researcher is analyzing data on lead exposure (µg/dL) and IQ scores in children. The covariance is calculated to be -25. What does the negative sign of the covariance signify? a) The average lead exposure is 25 µg/dL. b) The average IQ score is 25. c) Higher lead exposure is associated with higher IQ scores. d) Higher lead exposure is associated with lower IQ scores. 6. In the formula for the correlation coefficient, r = Cov(X,Y) / (σx σy), what does σx represent? a) The covariance of X. b) The mean of X. c) The variance of X. d) The standard deviation of X. 7. A public health dataset includes two variables: X = age in years and Y = blood pressure in mmHg. If a researcher mistakenly records all ages in months instead of years (i.e., multiplies all ages by 12), how will the correlation coefficient between age and blood pressure be affected? a) It will be multiplied by 12. b) It will be divided by 12. c) It will remain the same. d) It will become negative. 8. Which of the following correlation values indicates the strongest linear relationship? a) r = 0.65 b) r = -0.80 c) r = 0.10 d) r = -0.25 9. A study reports a correlation of r = 0.3 between the number of hours of sunlight exposure and Vitamin D levels. What is the most accurate description of this relationship? a) A strong, positive linear relationship. b) A weak, positive linear relationship. c) A strong, negative linear relationship. d) No linear relationship. 10. A researcher calculates the covariance between the number of cigarettes smoked per day and lung capacity and finds it to be -4.2. What is the most important limitation of this value for interpreting the relationship? a) The sign is incorrect, as smoking should increase lung capacity. b) It is impossible for covariance to be a negative number. c) The magnitude of the covariance (-4.2) is difficult to interpret without knowing the units of the variables. d) Covariance can only be calculated for normally distributed data. 11. In a study of 12 different communities, the covariance between the number of public parks and the rate of physical activity is 35. The standard deviation of the number of parks is 5, and the standard deviation of the physical activity rate is 10. What is the correlation coefficient? a) 0.35 b) 0.70 c) 1.75 d) 0.07 12. A public health official wants to demonstrate that a new anti-smoking campaign is associated with a reduction in smoking rates. After the campaign, she finds a correlation of r = -0.5 between the number of times a person saw the campaign ad and their number of cigarettes smoked per day. What is the most critical error in concluding the campaign caused* the reduction? a) The correlation is not negative. b) The correlation is too weak to be meaningful. c) Correlation does not imply causation; there may be confounding factors. d) She should have used covariance instead of correlation. 13. A researcher is examining the relationship between two variables, X and Y. The scatterplot of the data shows a perfect U-shape. What would the calculated Pearson correlation coefficient, r, most likely be? a) r = 1 b) r = -1 c) r = 0 d) r = 0.5 14. A study of patient satisfaction (scored 1-100) and wait
This geography problem is solved step by step below, with detailed explanations to help you understand the method and arrive at the correct answer.
ScanSolve AI Answer
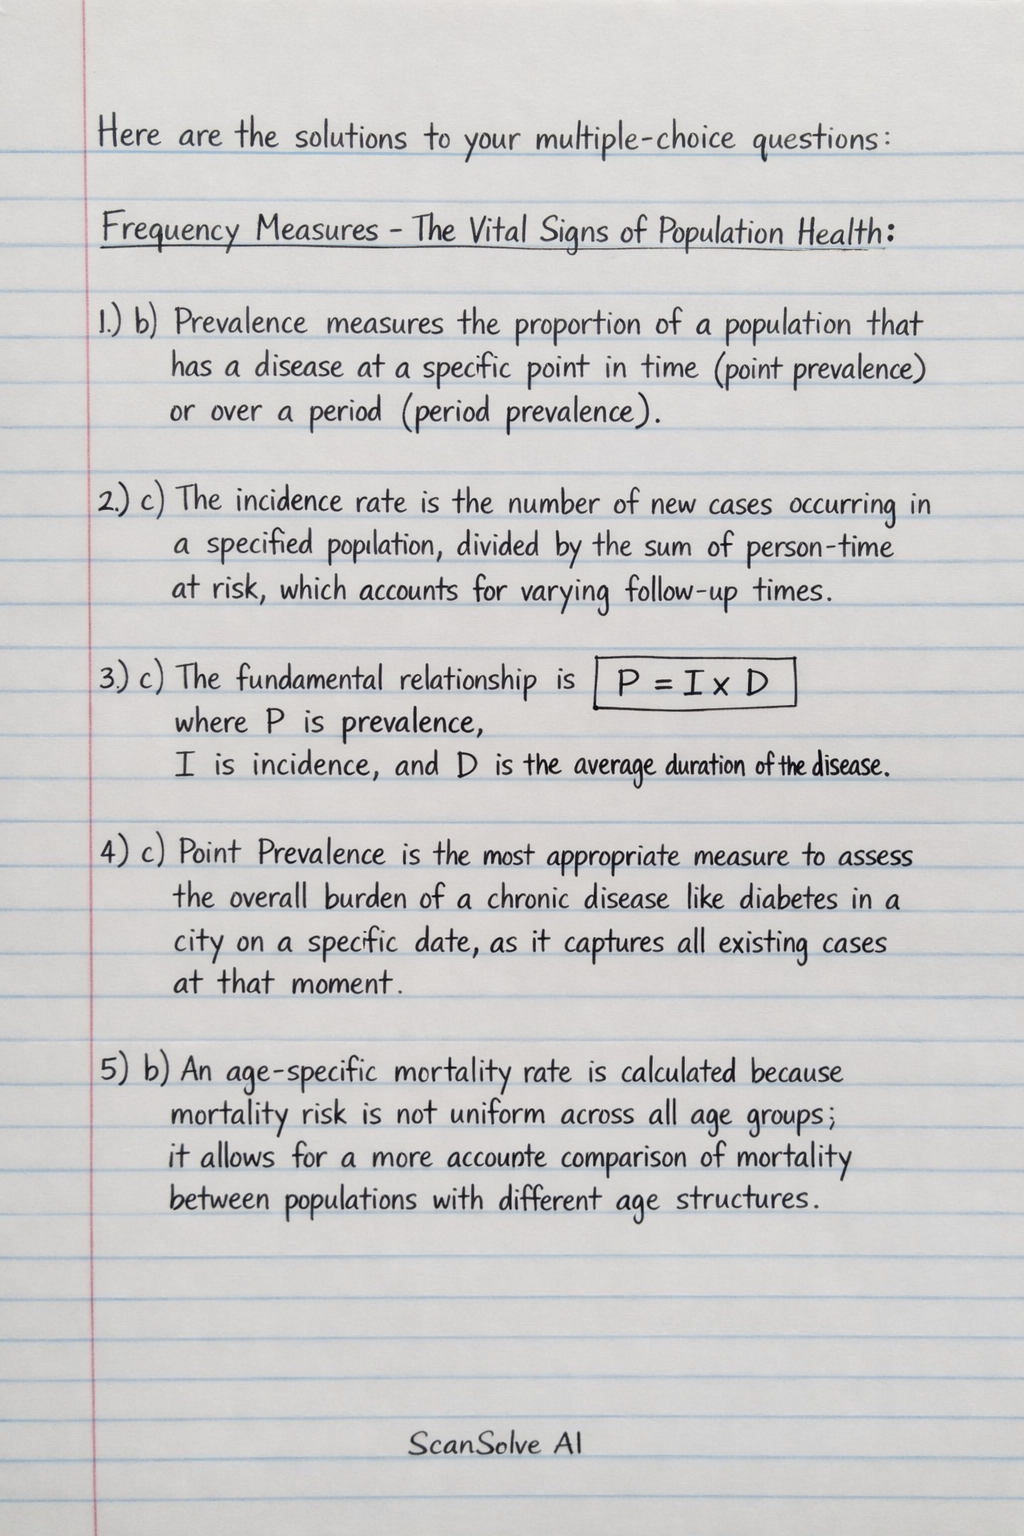
Here are the solutions to your multiple-choice questions:
Frequency Measures - The Vital Signs of Population Health:
1. b) Prevalence measures the proportion of a population that has a disease at a specific point in time (point prevalence) or over a period (period prevalence).
2. c) The incidence rate is the number of new cases occurring in a specified population, divided by the sum of person-time at risk, which accounts for varying follow-up times.
3. c) The fundamental relationship is $\boxed{P = I \times D}$, where P is prevalence, I is incidence, and D is the average duration of the disease.
4. c) Point Prevalence is the most appropriate measure to assess the overall burden of a chronic disease like diabetes in a city on a specific date, as it captures all existing cases at that moment.
5. b) An age-specific mortality rate is calculated because mortality risk is not uniform across all age groups; it allows for a more accurate comparison of mortality between populations with different age structures.
6. b) For calculating incidence, the denominator must be the population at risk of developing the disease. Students who have never had chickenpox are the ones susceptible to new infections.
7. b) Point prevalence is calculated as the number of existing cases divided by the total population at that specific point in time.
$$ \text{Point Prevalence} = \frac{\text{Number of existing cases}}{\text{Total population}} = \frac{100}{2000} $$
8. a) Cumulative incidence (or risk) is calculated as the number of new cases over a period divided by the population at risk at the start of the period.
$$ \text{Cumulative Incidence} = \frac{\text{Number of new cases}}{\text{Population at risk at start}} = \frac{50}{500} $$
9. c) If incidence (new infections) remains constant but the duration of the disease (lifespan of infected patients) increases, then the total number of existing cases (prevalence) will increase. This is explained by the relationship $P = I \times D$.
10. b) The incidence rate is calculated as the number of new cases divided by the total person-time at risk.
Number of new cases = 2 (Person C and Person D)
Total person-time = 3 (A) + 5 (B) + 4 (C) + 2 (D) = 14 person-years
$$ \text{Incidence Rate} = \frac{2 \text{ cases}}{14 \text{ person-years}} $$
Measures of Association:
c) Relative risk (RR) greater than 1 indicates a higher risk of disease in the exposed group*.
b) The incidence rate* describes the number of new cases of a disease occurring in a specific time period.
b)* To find the incidence rate per 1,000 people:
$$ \text{Incidence Rate} = \frac{500 \text{ new cases}}{100,000 \text{ population}} = 0.005 $$
$$ \text{Per 1,000 people} = 0.005 \times 1,000 = \boxed{5} $$
b) The odds ratio (OR) is used to measure the strength of association between two categorical variables*, especially in case-control studies.
a) The relative risk (RR) is defined as the probability of an event occurring in the exposed group divided by the probability of it occurring in the non-exposed group*.
Linear Correlation Coefficient (r) and Covariance:
1. c) The possible range of values for the linear correlation coefficient, r, is from $\boxed{-1 \text{ to } 1}$.
2. c) If the covariance between two variables, X and Y, is zero, it indicates that there is no linear relationship between X and Y.
3. b) The primary advantage of the correlation coefficient (r) over the covariance is that the correlation coefficient (r) is a unitless measure, allowing for comparison between different variables.
4. b) A correlation of $r = -0.75$ indicates a strong negative linear relationship
