
HEATING CURVE COOLING CURVE Temp °C Temp °C | / |\ | / | \ | / | \ Tb|/ D-E: Plateau | \ B-C: Plateau | / | \ | / A-B: Heating solid | \ C-D
ScanSolve AI Answer
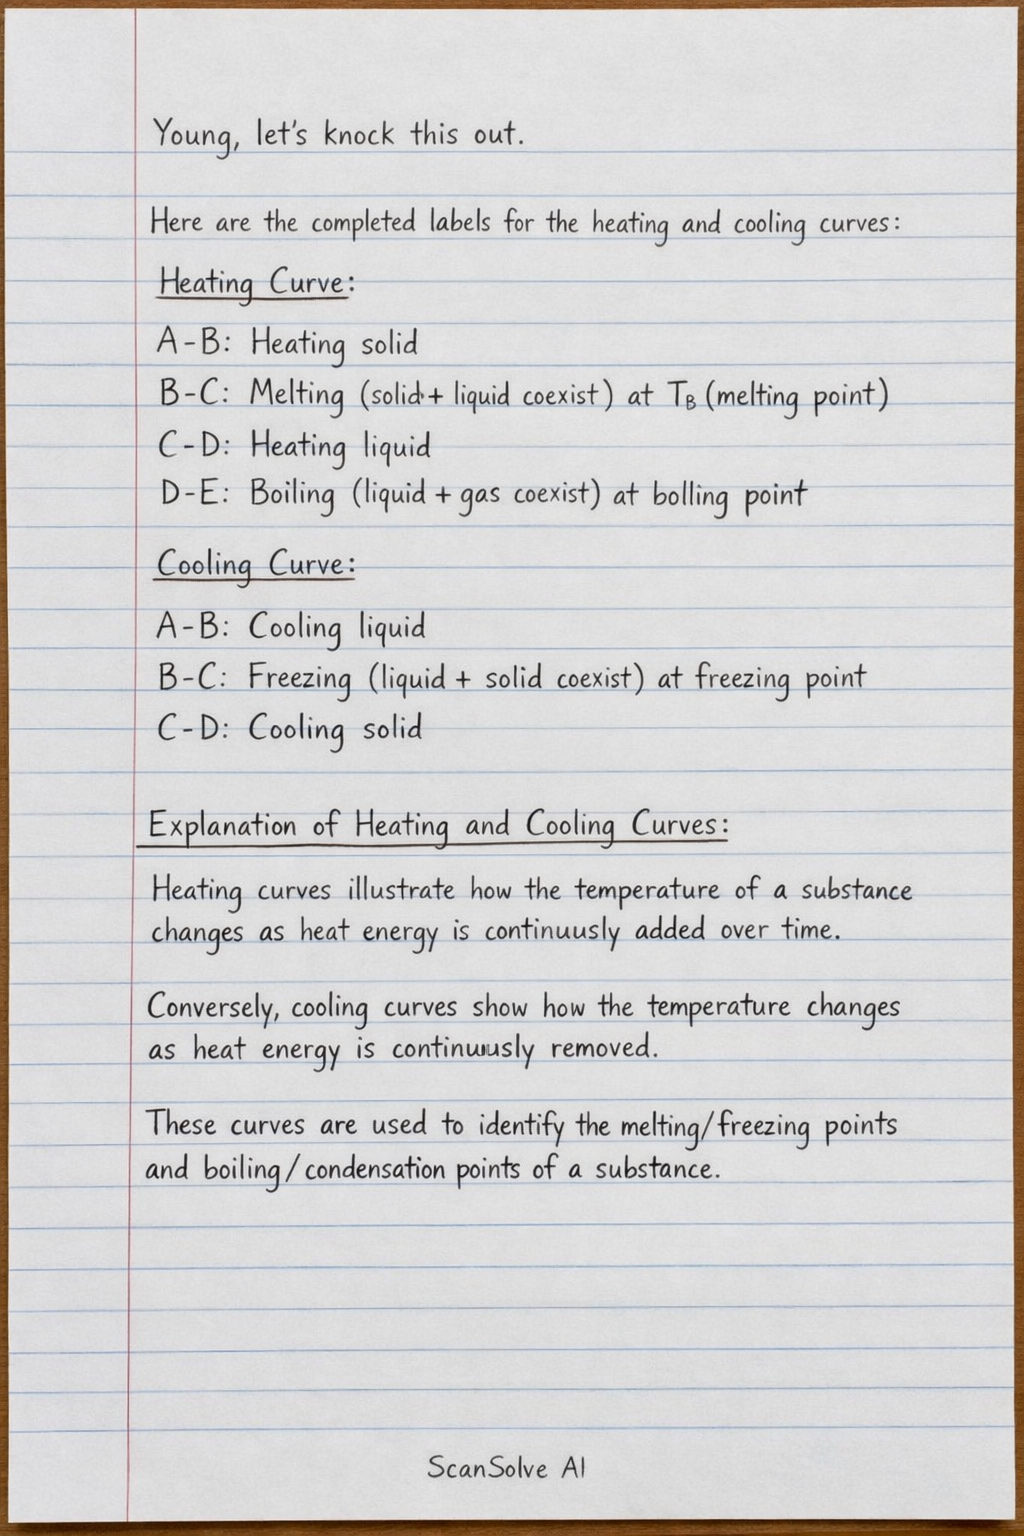
Here are the completed labels for the heating and cooling curves:
Heating Curve
- A-B: Heating solid
- B-C: Melting (solid and liquid coexist) at (melting point)
- C-D: Heating liquid
- D-E: Boiling (liquid and gas coexist) at boiling point
Cooling Curve
- A-B: Cooling liquid
- B-C: Freezing (liquid and solid coexist) at freezing point
- C-D: Cooling solid
Explanation of Heating and Cooling Curves:
Heating curves illustrate how the temperature of a substance changes as heat energy is continuously added over time. Conversely, cooling curves show how the temperature changes as heat energy is continuously removed. These curves are used to identify the melting/freezing points and boiling/condensation points of a substance.
Explanation of Plateaus:
The flat sections, or plateaus, on both heating and cooling curves represent phase changes. During these periods, the temperature of the substance remains constant even though heat is being added or removed. The energy supplied (during heating) or released (during cooling) is known as latent heat, and it is used to change the state of matter (e.g., solid to liquid, liquid to gas) by breaking or forming intermolecular bonds, rather than increasing or decreasing the kinetic energy of the particles.
Still stuck on this one?
Ask a follow-up, and the answer starts from this question.
More Geography Questions
Handwritten Step-by-Step Solution
Get this as a handwritten image on WhatsApp — like a tutor wrote it for you.
Try on WhatsApp