

This chemistry question involves key chemical concepts and calculations. The detailed solution below walks through each step, from identifying the reaction type to computing the final answer.
ScanSolve AI Answer
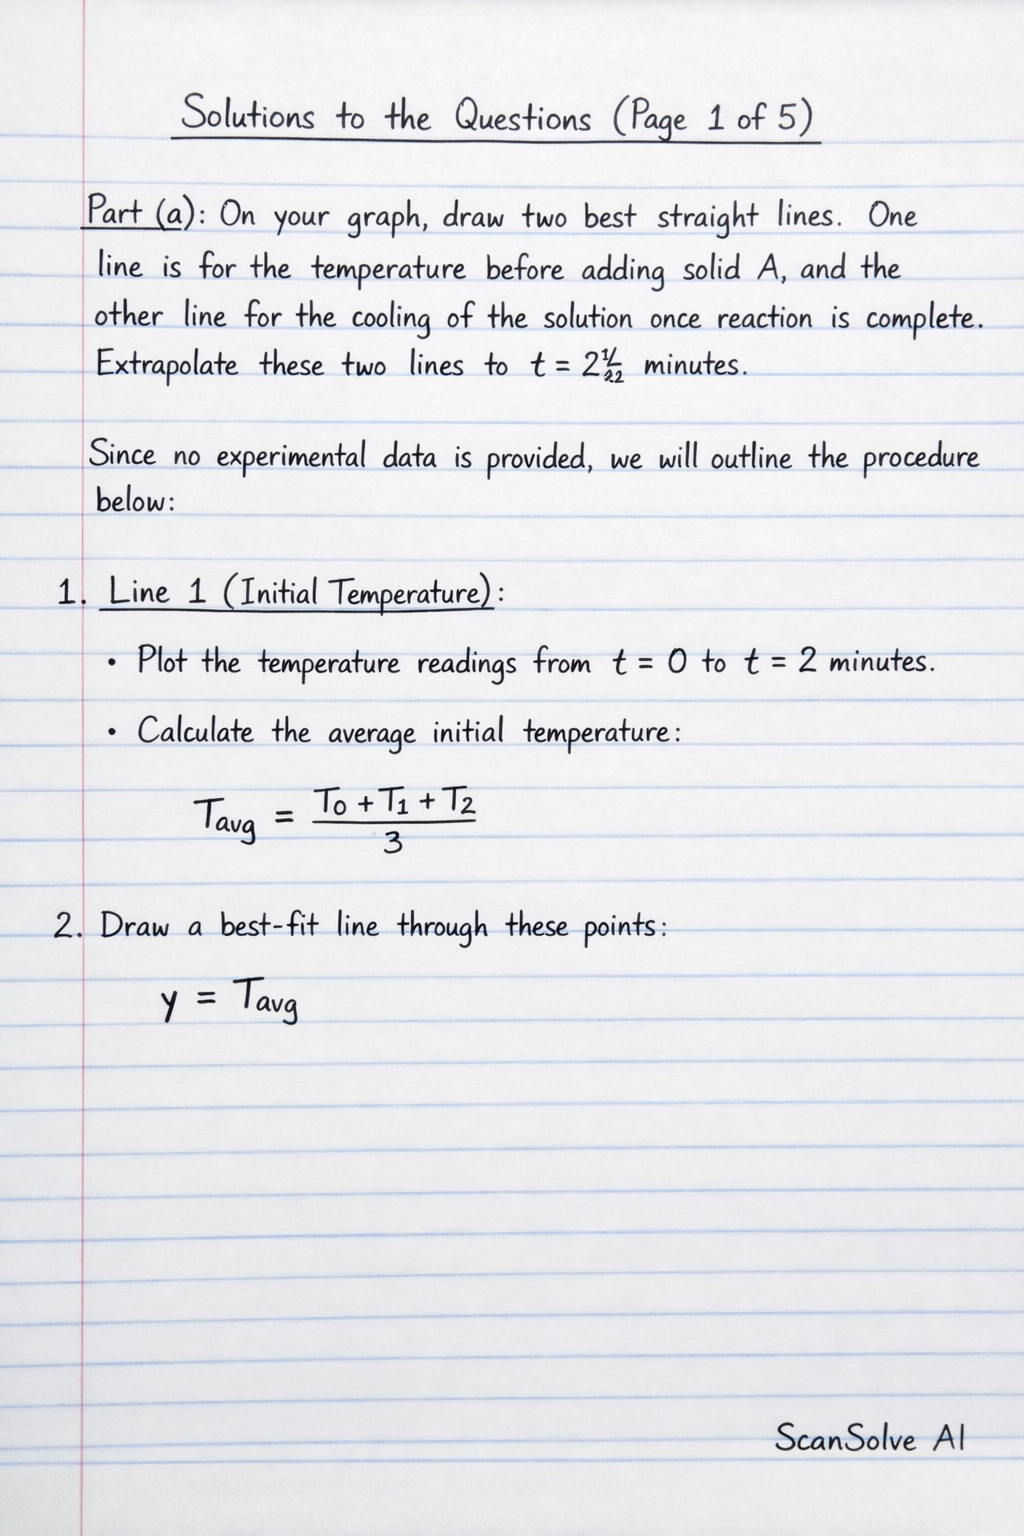
Here are the solutions to the questions based on the provided image. Part a) On your graph, draw two best straight lines. One line is for the temperature before adding solid A (sodium carbonate) and the other line for the cooling of the solution once reaction is complete. Extrapolate these two lines to t=2(1)/(2) minutes. Since no experimental data (temperature readings) or graph is provided, a physical drawing cannot be made. However, the procedure for drawing the lines is as follows: Line 1 (Initial Temperature): Plot the temperature readings from t=0 to t=2 minutes. Draw a best-fit straight line through these points. This line should be relatively flat, representing the initial temperature of the HCl solution before the reaction. Line 2 (Cooling Curve): After the maximum temperature is reached (which occurs shortly after t=2(1)/(2) minutes), the solution will start to cool. Plot the temperature readings from the maximum temperature onwards (e.g., from t=3 minutes to t=9 minutes). Draw a best-fit straight line through these cooling points. Extrapolation: Extend both lines back to the time of mixing, t=2(1)/(2) minutes. The intersection of the extrapolated cooling curve with the vertical line at t=2(1)/(2) minutes gives the theoretical maximum temperature. The initial temperature line gives the temperature of the solution just before mixing. Part b) From your graph, find the theoretical temperature rise ( T) at t=2(1)/(2) minutes. Without the graph, a numerical value for T cannot be determined. Step 1: Read the initial temperature (T_initial) from the first best-fit line at t=2(1)/(2) minutes (or the average initial temperature). Step 2: Read the extrapolated maximum temperature (T_max) from the second best-fit line (cooling curve) at t=2(1)/(2) minutes. Step 3: Calculate the temperature rise: T = T_max - T_initial The value of T would be in °C. Part c) Calculate the energy released in the reaction. (Assume 4.2 J of heat energy changes the temperature of 1.0 cm^3 of solution by 1.0 °C) Step 1: Determine the mass of the solution. Given that 1.0 cm^3 of solution has a heat capacity equivalent to 4.2 J °C^-1, we can infer that the specific heat capacity is 4.2 J g^-1 °C^-1 if we assume the density of the solution is 1.0 g cm^-3. The volume of HCl solution used is 25 cm^3. Mass of solution (m) = Volume × Density Mass of solution (m) = 25 cm^3 × 1.0 g cm^-3 = 25 g Step 2: Calculate the energy released (Q). The formula for heat energy released is Q = mc T. Q = 25 g × 4.2 J g^-1 °C^-1 × T Q = 105 × T J Without a numerical value for T from part (b), the energy released cannot be calculated numerically. The energy released would be 105 × T J. Part d) The equation for the reaction between anhydrous sodium carbonate and hydrochloric acid is shown: Na_2CO_3(s) + 2HCl(aq) 2NaCl(aq) + H_2O(l) + CO_2(g). The theoretical value for the enthalpy change of this reaction is -27.0 kJ mol^-1. Use this figure and the value that you found in (c), to find the mass of anhydrous sodium carbonate you used in the experiment. You should assume that no energy was lost to the surroundings in your experiment. (M_r(Na_2CO_3) = 106) Step 1: Convert the theoretical enthalpy change to Joules per mole. H_theoretical = -27.0 kJ mol^-1 = -27000 J mol^-1 Step 2: Calculate the moles of anhydrous sodium carbonate (Na_2CO_3) that reacted. The enthalpy change is defined as H = -(Q)/(moles). Therefore, moles = -(Q)/( H). Using the energy released Q from part (c) and the theoretical H: Moles of Na_2CO_3 = -(105 × T J)-27000 J mol^-1 Moles of Na_2CO_3 = (105 × T)/(27000) mol Step 3: Calculate the mass of anhydrous sodium carbonate. Mass of Na_2CO_3 = Moles × M_r(Na_2CO_3) Mass of Na_2CO_3 = ((105 × T)/(27000)) mol × 106 g mol^-1 Mass of Na_2CO_3 = (11130 × T)/(27000) g Mass of Na_2CO_3 = (1113 × T)/(2700) g Without a numerical value for T, the mass cannot be calculated numerically. The mass of anhydrous sodium carbonate used would be (1113 × T)/(2700) g. Part e) In your calculation in (d), what assumption have you made about the impurity present in the sample of anhydrous sodium carbonate used? The assumption made is that the impurity present in the sample of anhydrous sodium carbonate is inert and does not react with hydrochloric acid, nor does it absorb or release any heat during the reaction. Therefore, all the heat released is attributed solely to the reaction of the anhydrous sodium carbonate. Part f) A student decided to confirm by experiment the theoretical value for the enthalpy change of the reaction between anhydrous sodium carbonate and hydrochloric acid. The student mistakenly weighed a sample of hydrated sodium carbonate, Na_2CO_3 · 10H_2O, instead of anhydrous sodium carbonate, Na_2CO_3. State what effect this would have on the calculated value of the enthalpy change for the reaction. Explain your answer. If the student mistakenly used hydrated sodium carbonate (Na_2CO_3 · 10H_2O) instead of anhydrous sodium carbonate (Na_2CO_3) for the same weighed mass, the calculated enthalpy change would be more exothermic (a larger negative value). Explanation: For a given mass, hydrated sodium carbonate contains less actual Na_2CO_3 by mass compared to anhydrous sodium carbonate, because a significant portion of its molar mass is due to water of crystallization. When calculating the moles of Na_2CO_3 from the weighed mass, the student would use the molar mass of anhydrous Na_2CO_3 (106 g mol^-1). This would lead to an overestimation* of the moles of Na_2CO_3 that actually reacted. The enthalpy change is calculated as H = -(Q)/(moles). If the measured heat released (Q) is divided by an overestimated number of moles, the resulting calculated enthalpy change ( H) will have a smaller magnitude* (i.e., less negative). However, the question asks about the effect on the calculated value of the enthalpy change for the reaction. The reaction is between Na_2CO_3 and HCl. If the student assumes they have a certain number of moles of Na_2CO_3 (based on the anhydrous molar mass) but actually have fewer moles reacting (because some of the mass is water), then the heat measured (Q) is produced by fewer actual moles of Na_2CO_3. To get the enthalpy change per mole of Na_2CO_3, you would divide the measured Q by the actual (smaller) number of moles. If the student incorrectly uses the larger (assumed) number of moles in their calculation, the calculated H will be less exothermic* (closer to zero). Let's re-evaluate the effect carefully. If the student weighs X grams of solid and assumes it's Na_2CO_3, they calculate moles as n_assumed = X / M_r(Na_2CO_3). If it's actually Na_2CO_3 · 10H_2O, the actual moles of Na_2CO_3 reacting are $n_actual = X / M_r(Na_2CO_3 · 10