
We read your photo as:
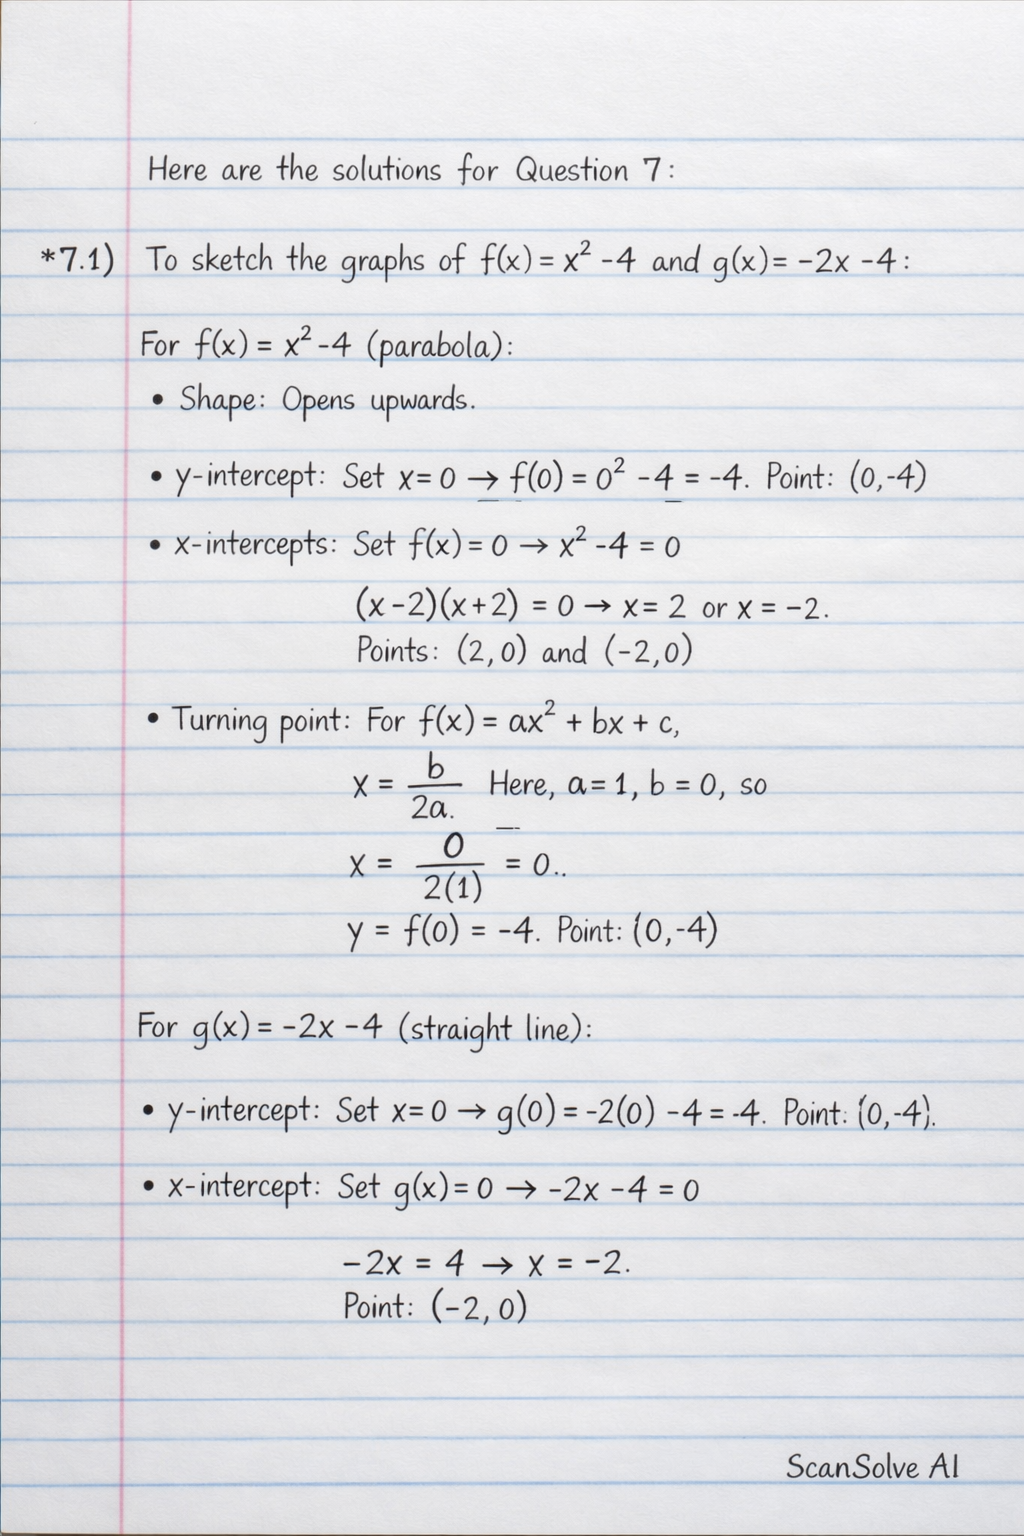
To sketch the graphs of f(x) = x2 − 4 and g(x) = -2x - 4:
ScanSolve AI Answer
Answer
Step-by-step solution
6 steps7.1) To sketch the graphs of and :
For (parabola):
- Shape: Opens upwards.
- y-intercept: Set . Point: .
- x-intercepts: Set or . Points: and .
- Turning point: For , the x-coordinate of the turning point is . Here, , so . The y-coordinate is . Point: .
For (straight line):
- y-intercept: Set . Point: .
- x-intercept: Set . Point: .
Sketching instructions:
Draw a Cartesian plane with x and y axes.
- Plot the points , , and for . Draw a smooth parabola passing through these points, opening upwards, with as its minimum turning point.
- Plot the points and for . Draw a straight line passing through these two points. Notice that both graphs intersect at and .
7.2) Use your graphs to determine the values of x if:
7.2.1)
This occurs at the intersection points of the two graphs.
Set the equations equal to each other.
Rearrange the equation to solve for .
Factor out .
Solve for .
The values of where are .
7.2.2)
This means finding the x-values where the graph of is below the x-axis.Identify the x-intercepts of , which are and .
Since the parabola opens upwards, it is below the x-axis between its x-intercepts.
The values of where are .
7.3) How can you use the graph of to obtain the graph of ?
Given .
To obtain from , we compare the two functions:We can see that , because .
Therefore, you can obtain the graph of by shifting the graph of vertically upwards by 7 units.
Try one yourself
A new problem that tests the same skill.
Still stuck on this one?
Ask a follow-up, and the answer starts from this question.
More Mathematics Questions
Handwritten Step-by-Step Solution
Get this as a handwritten image on WhatsApp — like a tutor wrote it for you.
Try on WhatsApp