
We read your photo as:
A graph shows the number of shoes sold each day from Monday to Sunday. Analyze the sales data to answer the following:
Mathematics
ScanSolve AI Answer
Step-by-step solution
5 stepsPart a· 1 step
During which days of the week was there an increase in the sales?
Observe the graph for segments where the "Number of shoes sold" increases.
- From Monday (5 shoes) to Tuesday (10 shoes), sales increased.
- From Tuesday (10 shoes) to Wednesday (15 shoes), sales increased.
- From Thursday (5 shoes) to Friday (25 shoes), sales increased. The sales increased from Monday to Tuesday, from Tuesday to Wednesday, and from Thursday to Friday.
Part b· 1 step
During which day was there a decrease in sales?
Observe the graph for segments where the "Number of shoes sold" decreases.
- From Wednesday (15 shoes) to Thursday (5 shoes), sales decreased. The sales decreased on Thursday.
Part c· 1 step
What happened to the number of sales from Friday to Sunday?
Read the sales figures for Friday, Saturday, and Sunday.
- Friday: 25 shoes
- Saturday: 25 shoes
- Sunday: 25 shoes The number of sales remained constant at 25 shoes from Friday to Sunday.
Part d· 2 steps
How would you describe the slope of the sales from Monday to Wednesday?
Identify the sales figures for Monday, Tuesday, and Wednesday.
- Monday: 5 shoes
- Tuesday: 10 shoes
- Wednesday: 15 shoes
Calculate the change in sales per day.
- From Monday to Tuesday: shoes increase.
- From Tuesday to Wednesday: shoes increase. The slope is positive and constant, indicating a steady increase of 5 shoes sold per day.
Was this helpful?
Still stuck on this one?
Ask a follow-up, and the answer starts from this question.
Got a different question?Ask your own question
More Mathematics Questions
QThe table below shows the record of sales in a week. Use it to answer the questions below.QAnalyze the provided graph showing monthly car sales from July to December. Address the overall…QThe table shows the number of watches, rings, and brooches sold by a shop each day for a week. a)…QA store sold 200 pairs of sneakers at Sh 1,700 per pair, offering a 5% discount. Calculate the total…QA graph shows the number of push-ups Angel did each day for a week. Analyze the graph to answer the…
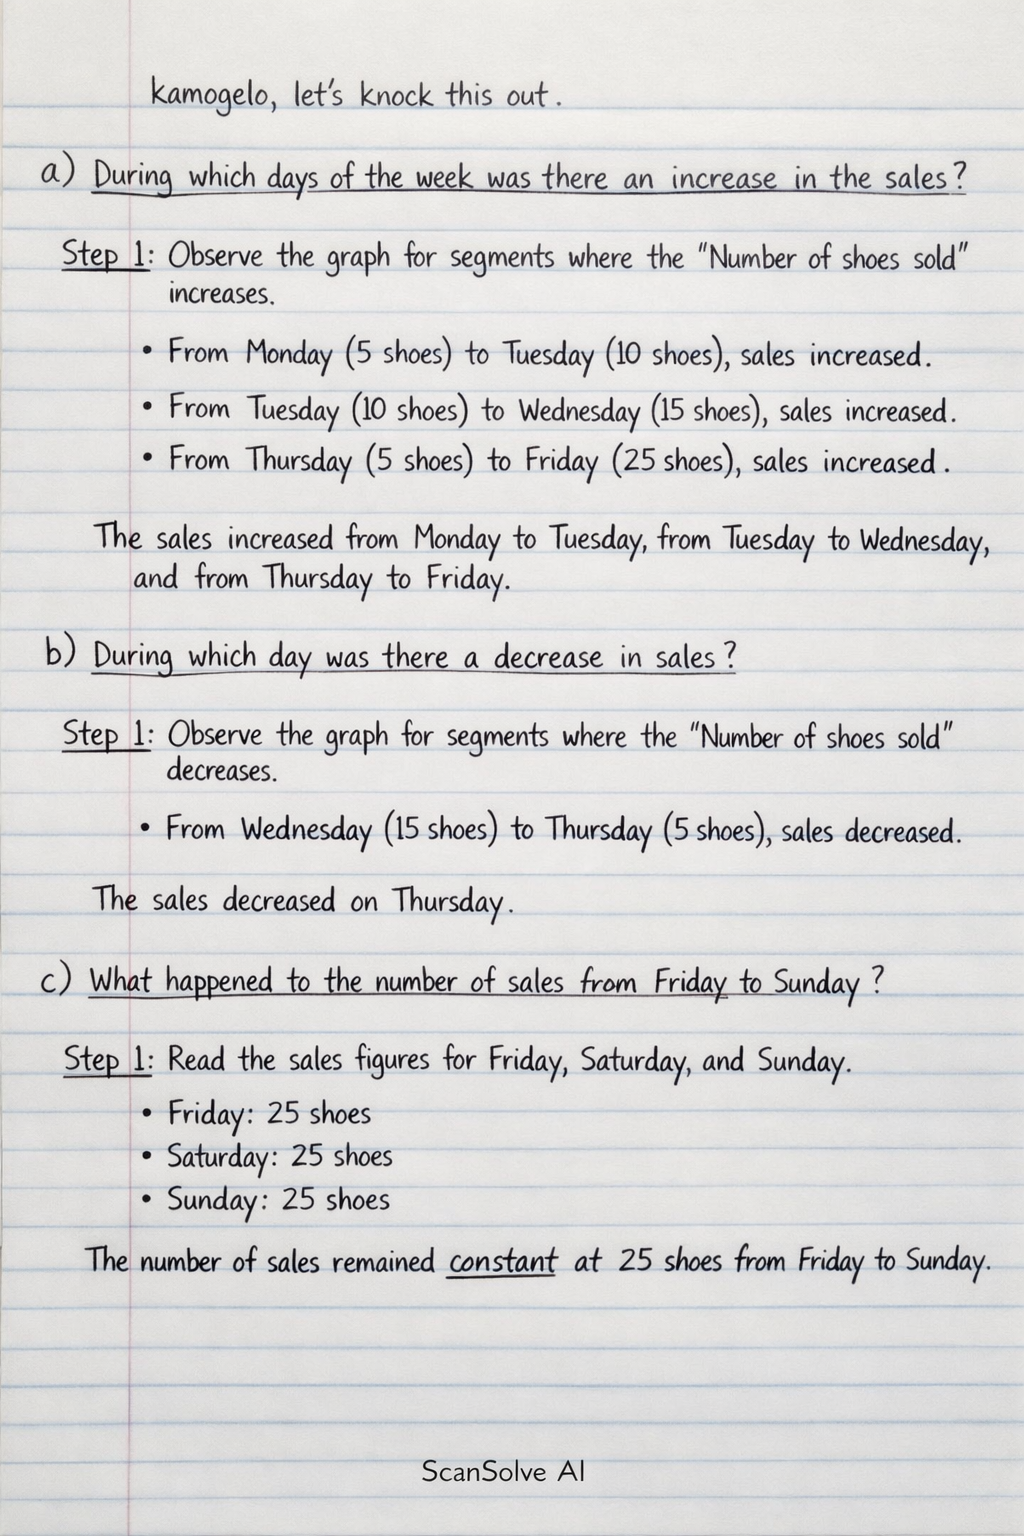
Handwritten Step-by-Step Solution
Get this as a handwritten image on WhatsApp — like a tutor wrote it for you.
Try on WhatsApp