
This mathematics problem involves applying core mathematical principles and formulas. Below you will find a complete step-by-step solution with detailed explanations for each step, helping you understand not just the answer but the method behind it.
ScanSolve AI Answer
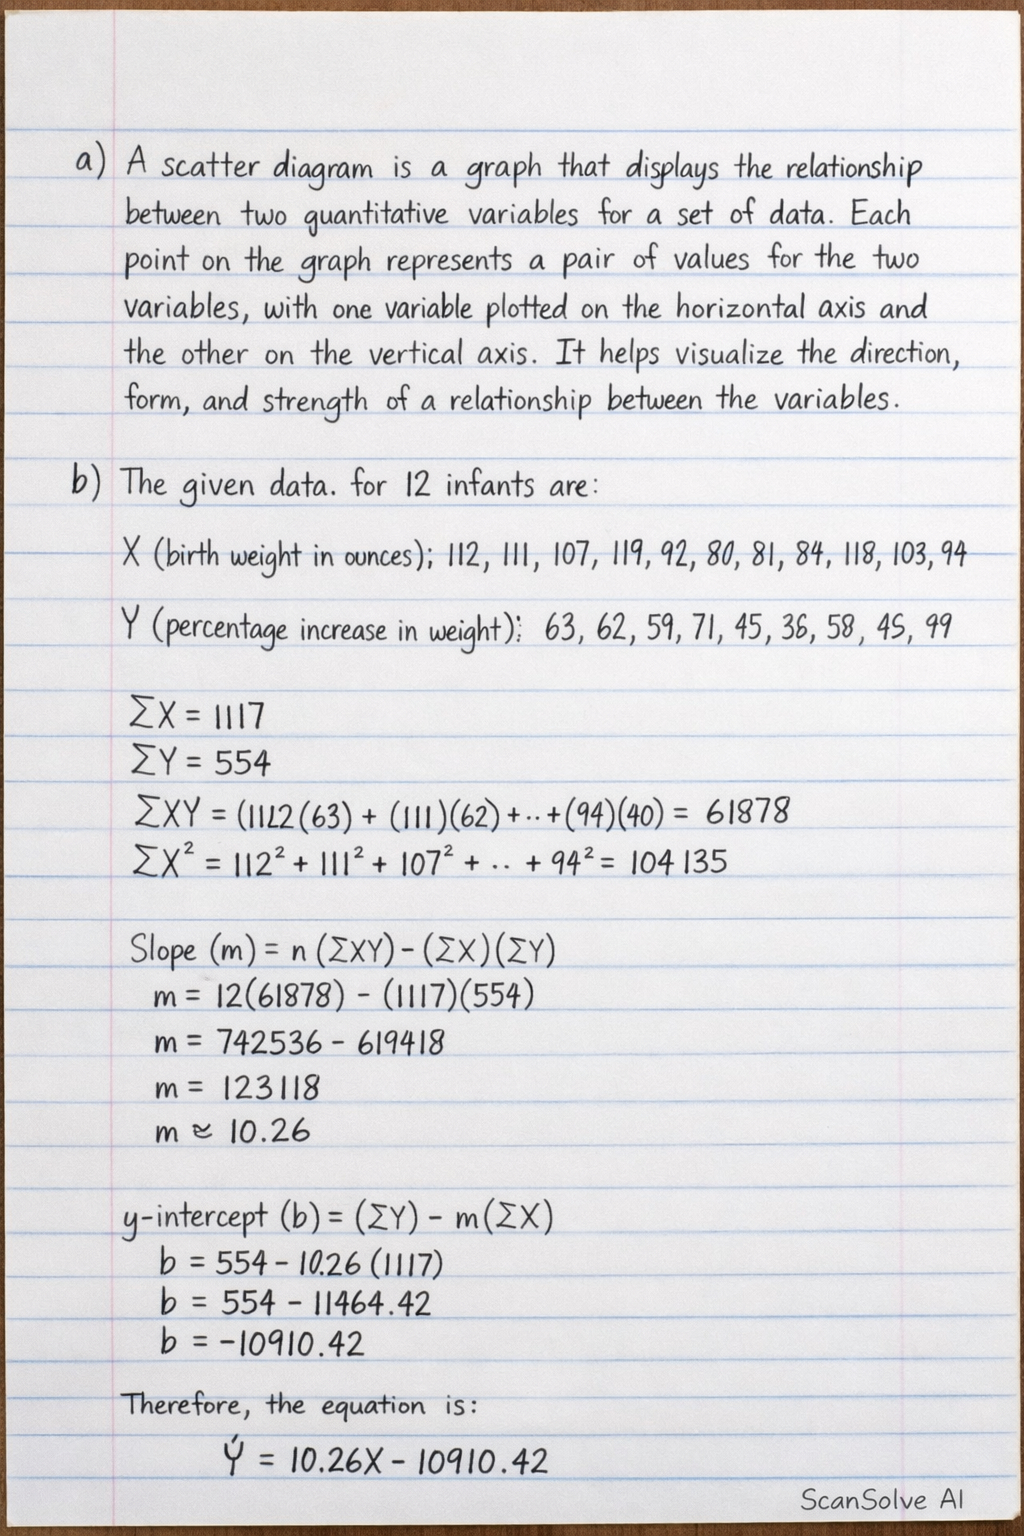
a) A scatter diagram is a graph that displays the relationship between two quantitative variables for a set of data. Each point on the graph represents a pair of values for the two variables, with one variable plotted on the horizontal axis and the other on the vertical axis. It helps visualize the direction, form, and strength of a relationship between the variables. b) The given data for 12 infants are: X (birth weight in ounces): 112, 111, 107, 119, 92, 80, 81, 84, 118, 106, 103, 94 Y (percentage increase in weight): 63, 6