
We read your photo as:
Analyze the patterns and derive a formula relating the number of black dots (n) to the number of grey dots (G) for questions 2.11.4, 2.11.5, and 2.11.6.
ScanSolve AI Answer
Answer
Step-by-step solution
10 stepsOkay, Mc, let's analyze this new set of patterns.
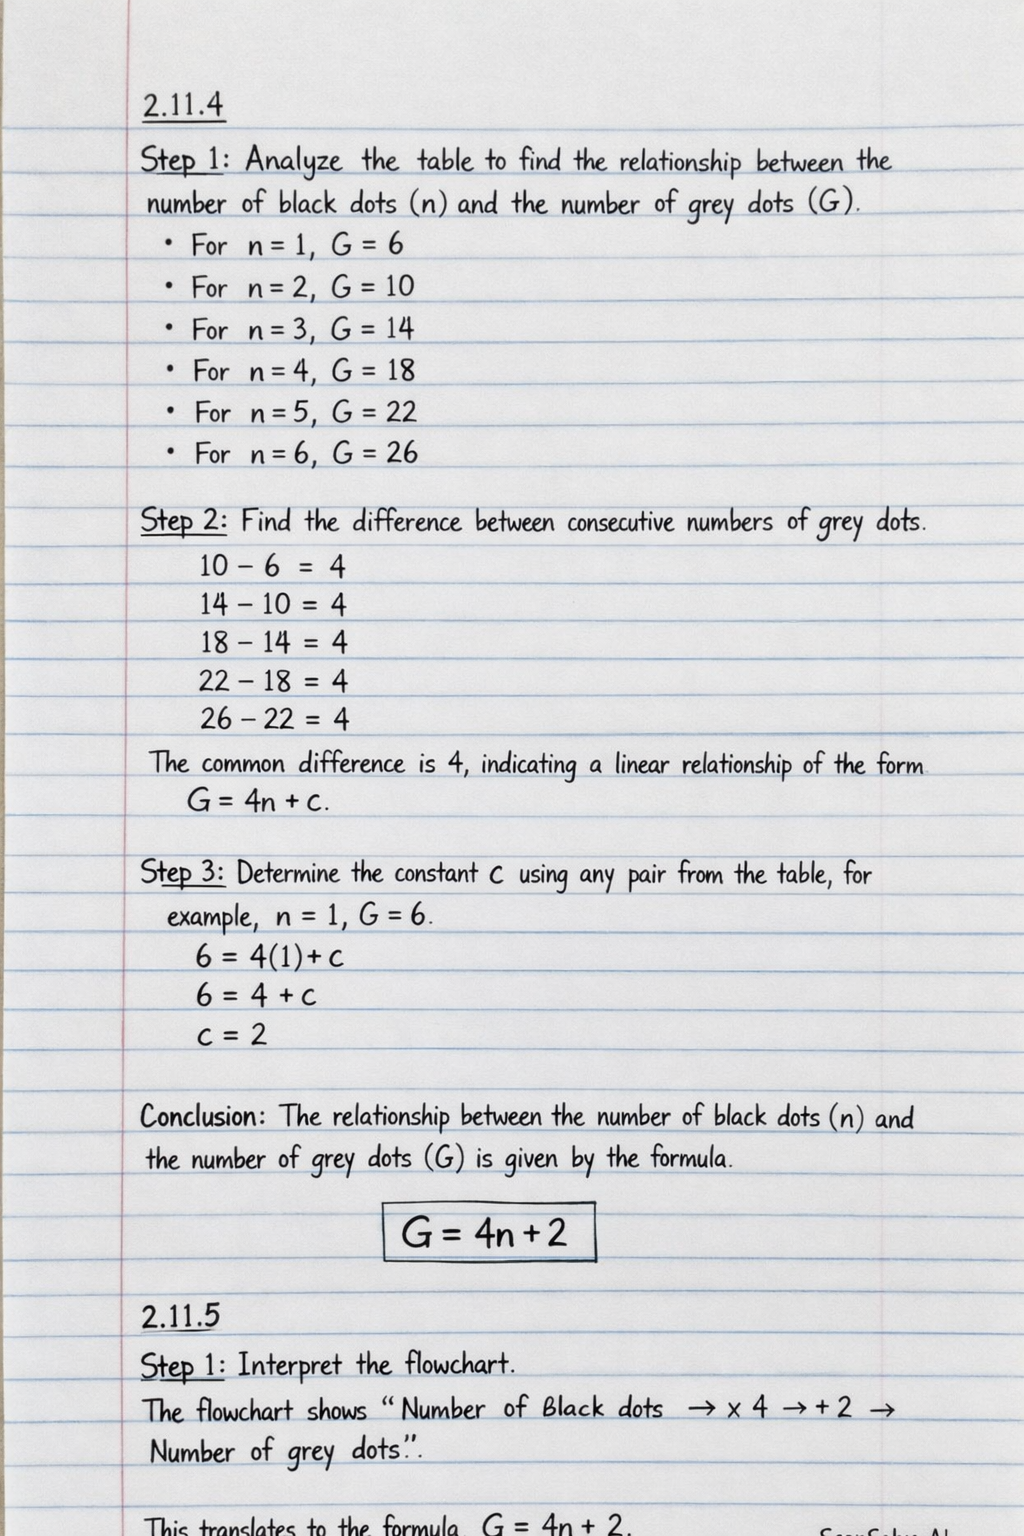
2.11.4
Analyze the table to find the relationship between the number of black dots () and the number of grey dots ().
- For ,
- For ,
- For ,
- For ,
- For ,
- For ,
Find the difference between consecutive numbers of grey dots.
The common difference is 4, indicating a linear relationship of the form .Determine the constant using any pair from the table, for example, .
Conclusion: The relationship between the number of black dots () and the number of grey dots () is given by the formula .
2.11.5
Interpret the flowchart.
The flowchart shows "Number of black dots Number of grey dots".
This translates to the formula .Compare this formula to the relationship found in 2.11.4.
The formula matches the relationship derived from the table in 2.11.4.
Conclusion: This flowchart between the number of black dots and grey dots from the table.
2.11.6
Interpret the flowchart.
The flowchart shows "Number of black dots Number of grey dots".
This translates to the formula .Simplify the formula.
Compare this formula to the relationship found in 2.11.4.
The simplified formula matches the relationship derived from the table in 2.11.4.
Conclusion: This flowchart between the number of black dots and grey dots from the table.
2.11.7
Interpret the statement.
The statement is "The number of grey dots = 4 x the number of black dots + 2".
This translates directly to the formula .Compare this formula to the relationship found in 2.11.4.
The formula matches the relationship derived from the table in 2.11.4.
Conclusion: This statement between the number of black dots and grey dots from the table.
Try one yourself
A new problem that tests the same skill.
Still stuck on this one?
Ask a follow-up, and the answer starts from this question.
More Mathematics Questions
Handwritten Step-by-Step Solution
Get this as a handwritten image on WhatsApp — like a tutor wrote it for you.
Try on WhatsApp