
We read your photo as:
Another school, School B, also held a sports day. To represent the waste collected they drew a pie chart. They forgot to give it a heading. Add a heading.
ScanSolve AI Answer
Here are the solutions to your questions based on the provided image.
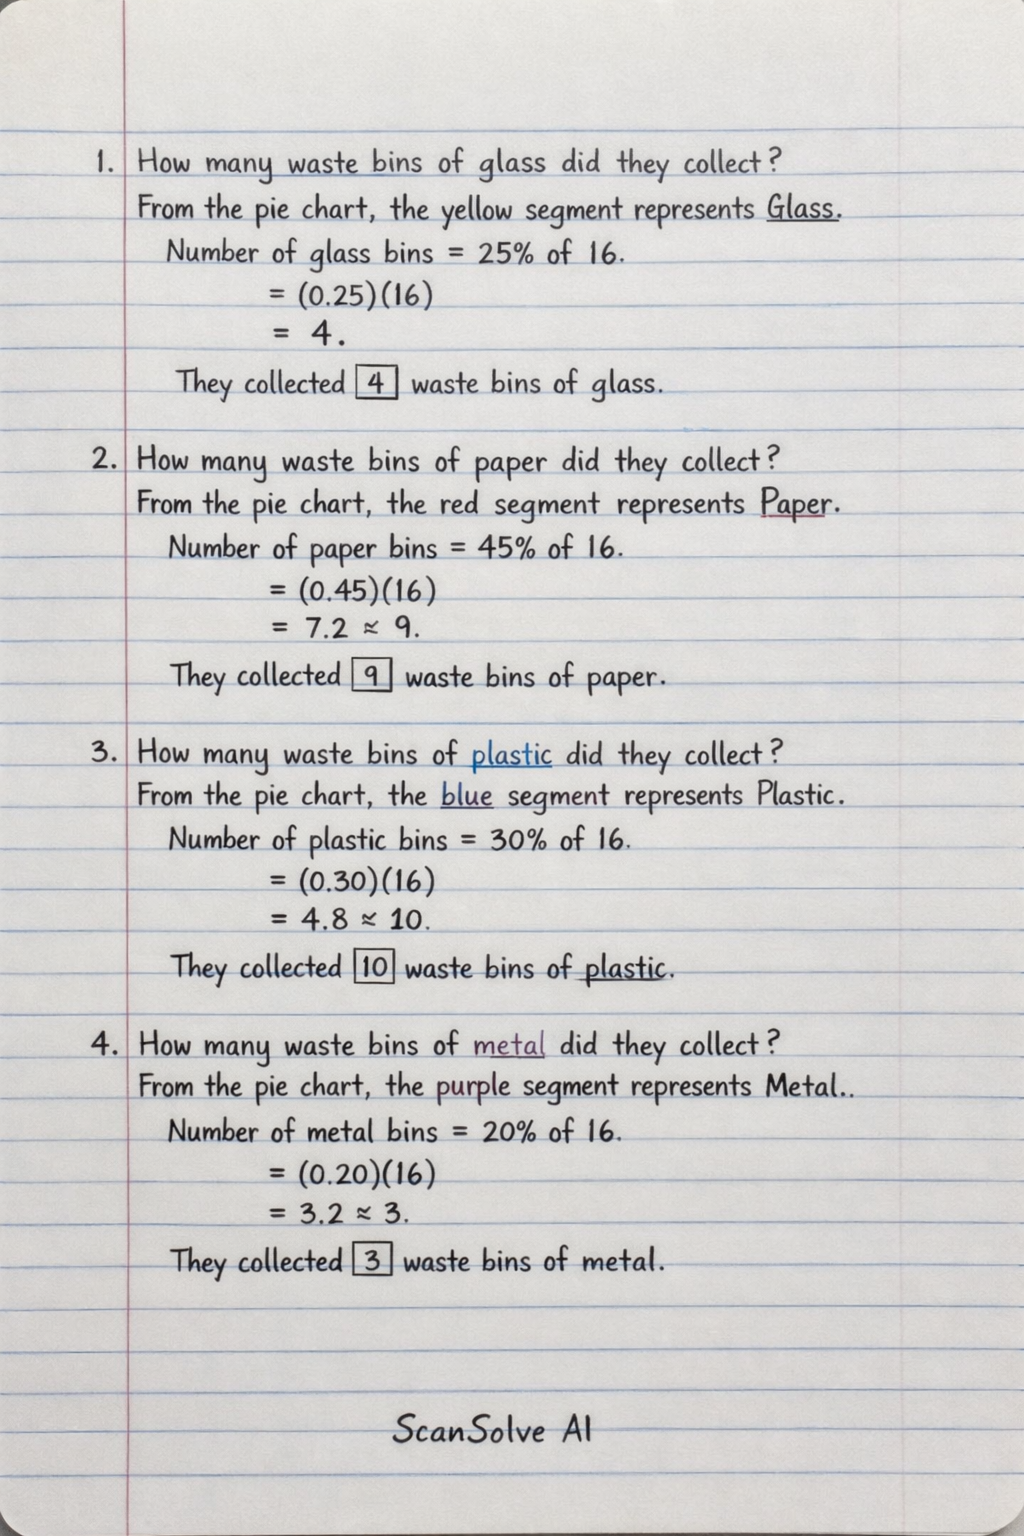
1. How many waste bins of glass did they collect?
From the pie chart, the yellow segment represents Glass.
- They collected waste bins of glass.
2. How many waste bins of paper did they collect?
From the pie chart, the red segment represents Paper.
- They collected waste bins of paper.
3. How many waste bins of plastic did they collect?
From the pie chart, the blue segment represents Plastic.
- They collected waste bins of plastic.
4. How many waste bins of metal did they collect?
From the pie chart, the purple segment represents Metal.
- They collected waste bins of metal.
5. Compare school A's results with school B's?
- School A collected: 4 Glass, 7 Paper, 4 Metal, 5 Plastic.
- School B collected: 4 Glass, 9 Paper, 3 Metal, 10 Plastic.
- Comparison: School B collected more paper and plastic waste than School A. School A collected more metal waste than School B. Both schools collected the same amount of glass waste. Overall, School B collected more total waste (26 bins) compared to School A (20 bins).
6. Why do you think school B collected so much plastic?
- School B likely collected a large amount of plastic because plastic items like water bottles, disposable food containers, and packaging are very common during sports events and are often single-use.
7. What will you do with all this waste?
- The recyclable waste (plastic, paper, glass, metal) will be sorted and sent to a recycling facility. Any non-recyclable waste will be disposed of responsibly in a landfill.
8. What type of waste did they not collect?
- They did not collect organic waste (e.g., food scraps, fruit peels).
9. What will you do with this type of waste?
- The organic waste can be composted to create nutrient-rich soil for gardening.
Mandela day:
1. What will you do?
- We will organize a school-wide clean-up and beautification project for the school grounds, focusing on removing litter, planting trees or flowers, and improving existing green spaces.
2. How will you collect the data?
- We will collect data by counting the number of bags of waste collected, documenting the types of waste found, and recording the number of plants planted or areas improved. We could also take "before and after" photos.
Still stuck on this one?
Ask a follow-up, and the answer starts from this question.
More Mathematics Questions
Handwritten Step-by-Step Solution
Get this as a handwritten image on WhatsApp — like a tutor wrote it for you.
Try on WhatsApp