
We read your photo as:
Draw a pie chart representing the distribution of students across different subjects. The number of students in each subject is as follows: Mathematics (45), Physics (39), Chemistry (28), Biology (14)
Mathematics
ScanSolve AI Answer
Step-by-step solution
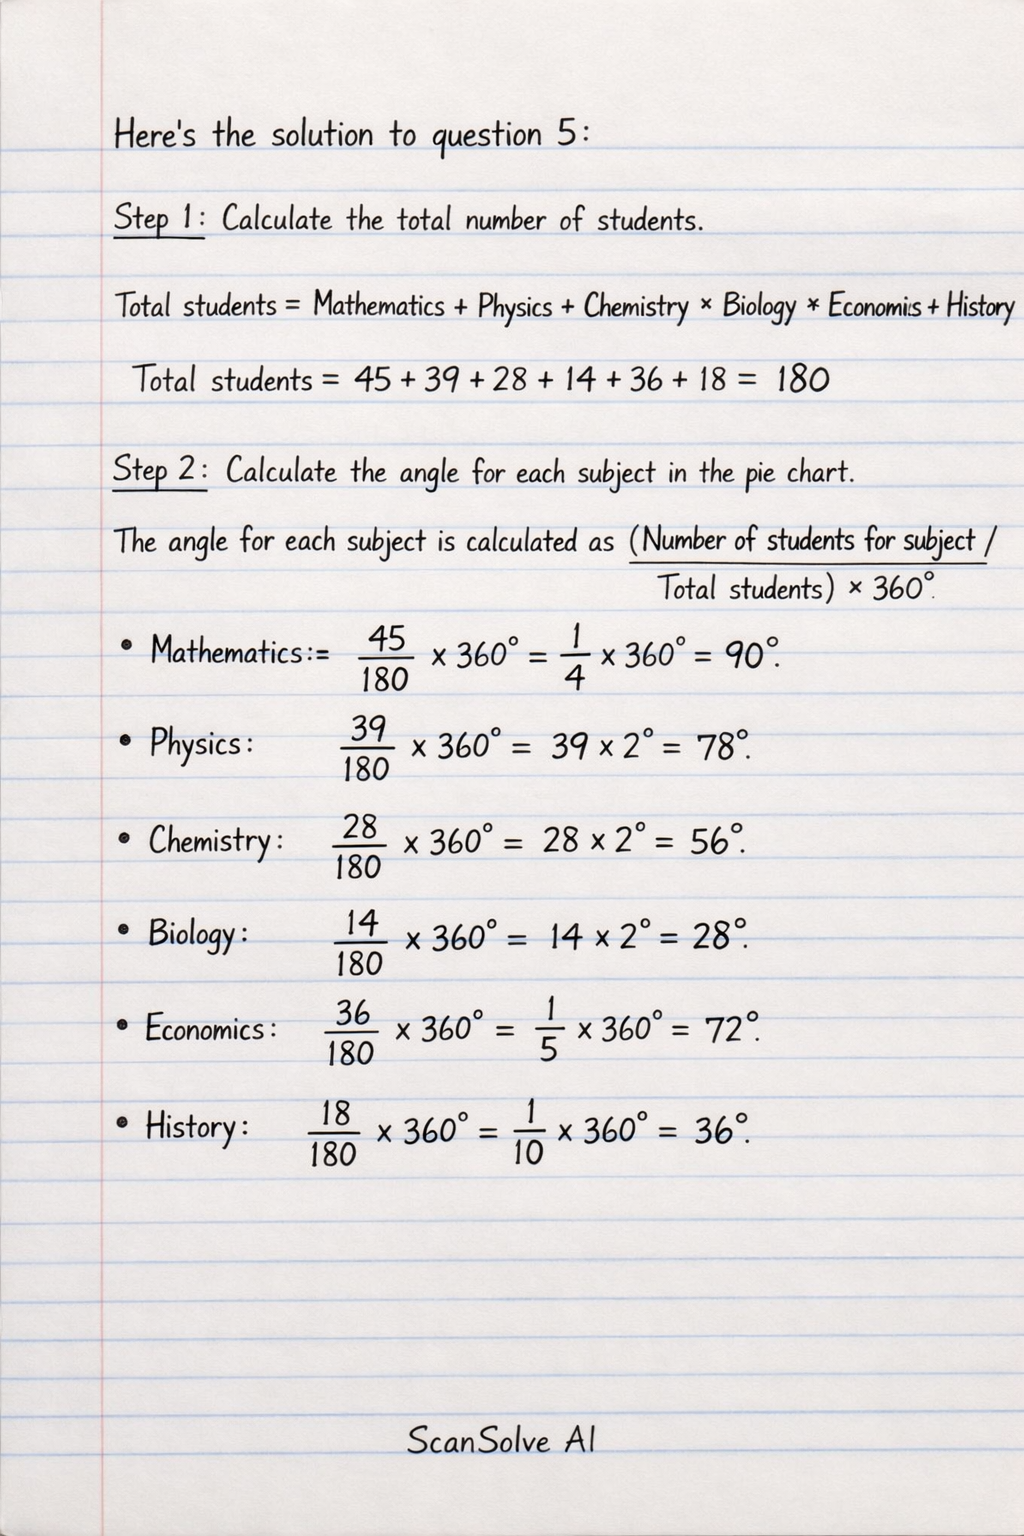
2 stepsHere's the solution to question 5:
To draw a pie chart, we first need to calculate the total number of students and then determine the angle for each subject.
Calculate the total number of students.
Total students = Mathematics + Physics + Chemistry + Biology + Economics + History
Calculate the angle for each subject in the pie chart.
The angle for each subject is calculated as .
- Mathematics:
- Physics:
- Chemistry:
- Biology:
- Economics:
- History:
The pie chart would be drawn with sectors corresponding to these angles:
Mathematics:
Physics:
Chemistry:
Biology:
Economics:
History:
Was this helpful?
Still stuck on this one?
Ask a follow-up, and the answer starts from this question.
Got a different question?Ask your own question
More Mathematics Questions
QA pie chart shows the hobbies of 180 pupils. Reading is 120°, Sports is 90°, Music is 60°. Calculate…QIn a survey of 200 students, the following information was gathered about their subject choices: 120…QI. Draw a Venn diagram to represent this information. Use your Venn diagram to calculate the number…QCreate a pie chart to represent the number of learners who prefer different games: Football (18)…QIn a group of 200 students, 120 study Mathematics, 90 study Physics, and 70 study Chemistry. 40…
Browse by topic:Statistics
Handwritten Step-by-Step Solution
Get this as a handwritten image on WhatsApp — like a tutor wrote it for you.
Try on WhatsApp