
We read your photo as:
Draw the cumulative frequency curve using the provided data.
Mathematics
ScanSolve AI Answer
Here are the solutions to the questions you sent:
Question 10
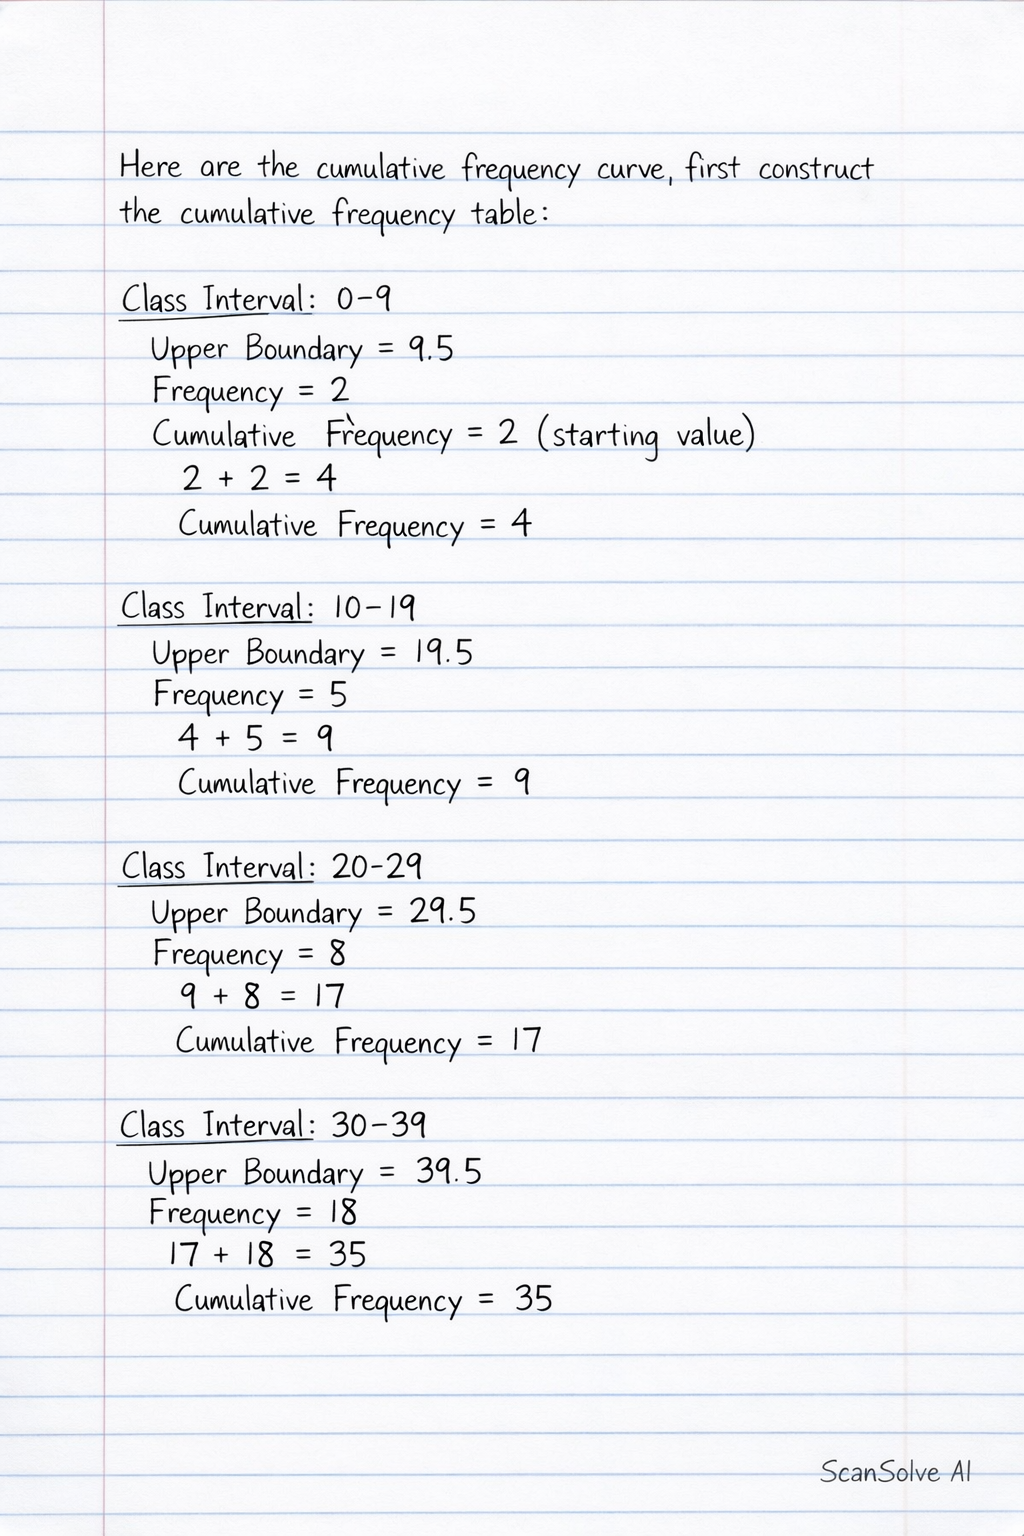
- 10 (a): To draw the cumulative frequency curve, first construct the cumulative frequency table:
| Marks (%) | Upper Boundary | Frequency | Cumulative Frequency |
|---|---|---|---|
| 0-9 | 9.5 | 2 | 2 |
| 10-19 | 19.5 | 5 | 7 |
| 20-29 | 29.5 | 8 | 15 |
| 30-39 | 39.5 | 18 |
Was this helpful?
Still stuck on this one?
Ask a follow-up, and the answer starts from this question.
Got a different question?Ask your own question
More Mathematics Questions
QDraw the cumulative frequency curve for the distribution.QPrepare a cumulative frequency table and draw an ogive for the given data.QComplete the cumulative frequency table and draw the cumulative frequency curve (ogive).QPrepare a cumulative frequency table for the given data.QConstruct a cumulative frequency table for the distribution.
Browse by topic:Statistics
Handwritten Step-by-Step Solution
Get this as a handwritten image on WhatsApp — like a tutor wrote it for you.
Try on WhatsApp