
Show every point on the graph and the numbers ,for easy to understand
ScanSolve AI Answer
Answers
2 partsStep-by-step solution
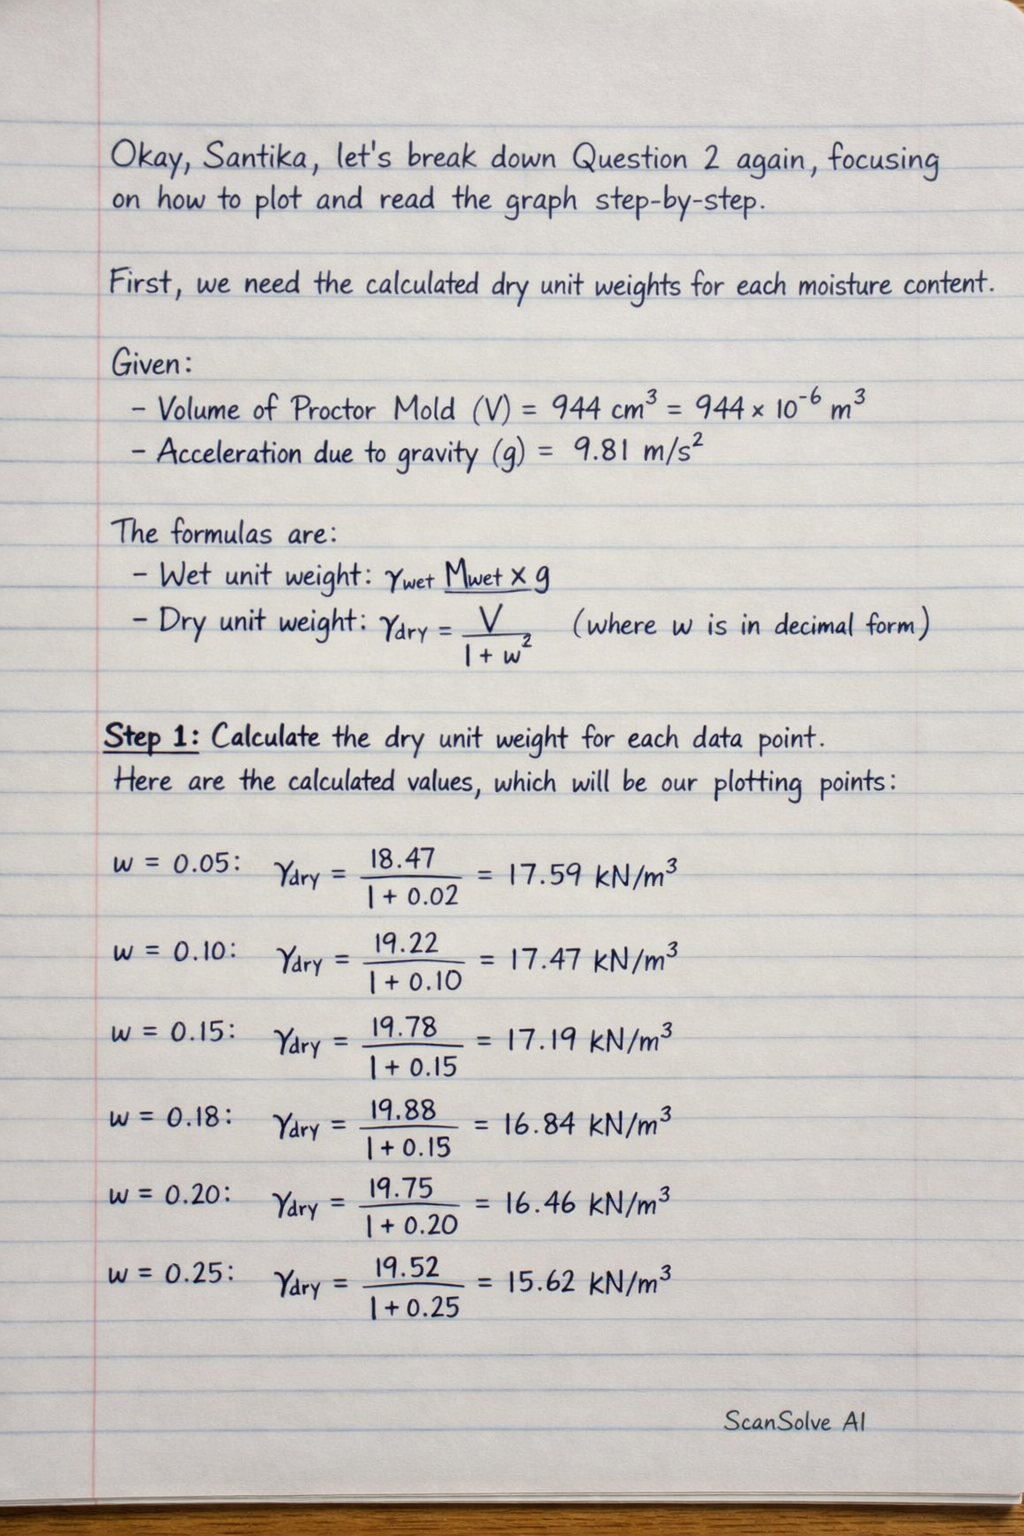
5 stepsOkay, Santika, let's break down Question 2 again, focusing on how to plot and read the graph step-by-step.
First, we need the calculated dry unit weights for each moisture content.
Given:
Volume of Proctor Mold () =
Acceleration due to gravity () =
The formulas are:
Wet unit weight:
Dry unit weight: (where is in decimal form)
Calculate the dry unit weight for each data point.
Here are the calculated values, which will be our plotting points:
(%) (decimal) (kg) () () 9.9 0.099 1.68 17.46 15.89 10.5 0.105 1.71 17.77 16.08 12.1 0.121 1.77 18.39 16.41 13.8 0.138 1.83 19.01 16.70 15.1 0.151 1.86 19.32 16.79 17.4 0.174 1.88 19.53 16.64 19.4 0.194 1.87 19.43 16.27 21.2 0.212 1.85 19.22 15.86 Set up the graph axes and plot the points.
-
Draw a horizontal axis (x-axis) and label it "Moisture Content ( %)". Choose a scale that covers the range from approximately 8% to 22%. For example, each major grid line could represent 1% moisture content.
-
Draw a vertical axis (y-axis) and label it "Dry Unit Weight ( )". Choose a scale that covers the range from approximately to . For example, each major grid line could represent .
-
Now, plot each data point from the table on your graph:
- Point 1: (, )
- Point 2: (, )
- Point 3: (, )
- Point 4: (, )
- Point 5: (, )
- Point 6: (, )
- Point 7: (, )
- Point 8: (, )
-
Draw the compaction curve.
- Once all points are plotted, draw a smooth curve that connects these points. This curve should rise to a peak and then fall, forming a bell-like shape.
Determine the maximum dry unit weight and optimum moisture content from the graph.
a)
- Locate the highest point on the smooth curve you just drew. This is the peak of the compaction curve.
- From this peak, draw a horizontal line to the y-axis. The value where it intersects the y-axis is the maximum dry unit weight (). You should read approximately .
- From the same peak, draw a vertical line down to the x-axis. The value where it intersects the x-axis is the optimum moisture content (OMC). You should read approximately .
The maximum dry unit weight is and the optimum moisture content is
\boxed{\text{15.1%}}.Determine the moisture content required to achieve 95% of from the graph.
b)
- Calculate 95% of the maximum dry unit weight:
- Locate on the y-axis.
- Draw a horizontal line from across to the left side of your compaction curve.
- Where this horizontal line intersects the curve (on the "dry" side, before the peak), draw a vertical line straight down to the x-axis.
- Read the value on the x-axis where this vertical line lands. This is the moisture content required. You should read approximately .
The moisture content required to achieve 95% of is approximately
\boxed{\text{10.09%}}.
Try one yourself
A new problem that tests the same skill.
Still stuck on this one?
Ask a follow-up, and the answer starts from this question.
More Mathematics Questions
Handwritten Step-by-Step Solution
Get this as a handwritten image on WhatsApp — like a tutor wrote it for you.
Try on WhatsApp