
This mathematics problem involves applying core mathematical principles and formulas. Below you will find a complete step-by-step solution with detailed explanations for each step, helping you understand not just the answer but the method behind it.
ScanSolve AI Answer
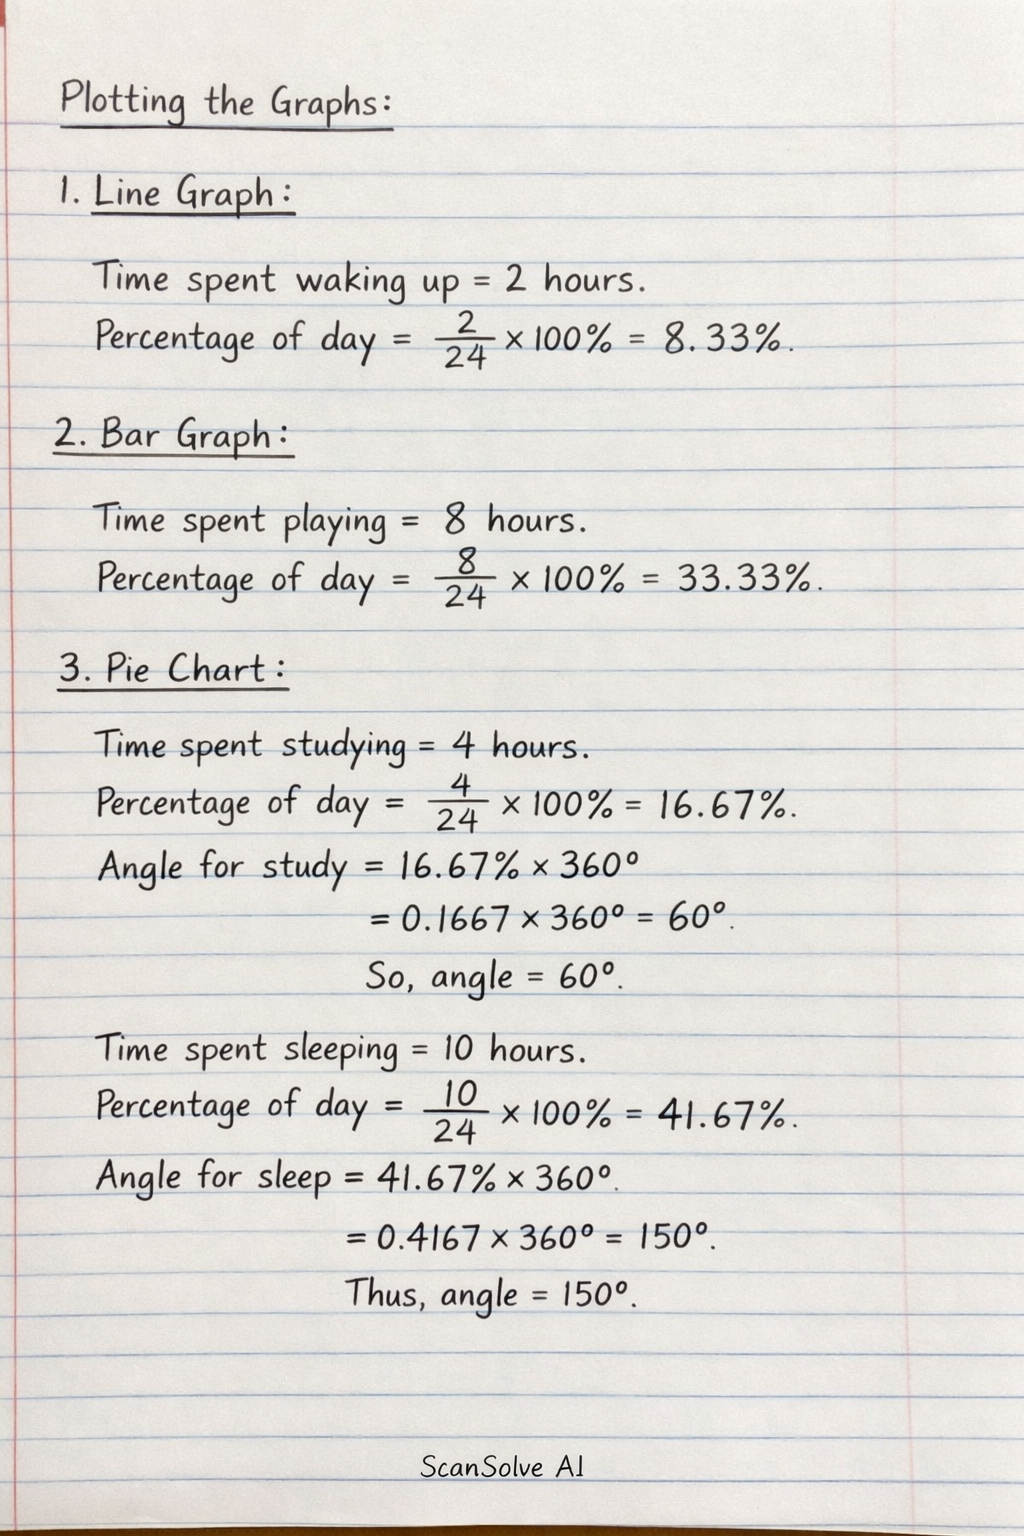
For Roll No. 27-39: You are required to prepare a simple daily routine chart for your summer holidays and plot a line graph, bar graph, and pie chart using the data. Here is a sample daily routine chart: Daily Routine Chart for Summer Holidays | Activity | Time (hours) | Percentage of Day | Angle for Pie Chart | | :------------------------ | :----------- | :---------------- | :------------------ | | Wake up/Morning routine | 2 | 8.33\% | 30^ | | Play/Leisure | 8 | 33.33\% | 120^ | | Study | 4 | 16.67\% | 60^ | | Sleep | 10 | 41.67\% | 150^ | | Total | 24 | 100\% | 360^ | --- Plotting the Graphs: 1. Line Graph: Plot the activities on the horizontal (x) axis and the time spent (in hours) on the vertical (y) axis. Mark a point for each activity corresponding to its time duration. Connect these points with lines. This graph will show the variation in time allocated to different activities. 2. Bar Graph: Draw a horizontal (x) axis for the activities (Wake up, Play, Study, Sleep) and a vertical (y) axis for the time spent (in hours). For each activity, draw a bar whose height corresponds to the number of hours spent on that activity. Ensure the bars are of equal width and are separated by equal spaces. This graph visually compares the duration of each activity. 3. Pie Chart: Draw a circle. Calculate the angle for each activity using the formula: Angle = ( Time for activityTotal time (24 hours) ) × 360^ Using a protractor, divide the circle into sectors based on these calculated angles: Wake up/Morning routine: ( (2)/(24) ) × 360^ = 30^ Play/Leisure: ( (8)/(24) ) × 360^ = 120^ Study: ( (4)/(24) ) × 360^ = 60^ Sleep: ( (10)/(24) ) × 360^ = 150^ Label each sector with the corresponding activity and its percentage. This chart shows the proportion of the day spent on each activity.