
We read your photo as:
Given the data set: 3, 4, 5, 7, 8, 9, 10, 11, 6, 13, 15, 21, 3. Calculate the average, the mode, and the probability of choosing a value less than 10 as a percentage.
ScanSolve AI Answer
Answers
5 partsStep-by-step solution
10 stepsHere are the solutions for the data set: .
First, let's sort the data set in ascending order:
.
The total number of data points is .
Part a· 2 steps
Determine the average of the data set.
Sum all the values in the data set.
Divide the sum by the total number of data points.
The average of the data set is .
Part b3
Determine the modal value of the data.
Identify the value that appears most frequently in the data set.
In the sorted data set (), the number 3 appears twice, while all other numbers appear only once.
The modal value is .
Part c
Determine the Probability of choosing a value that is less than 10. Your answer should be in percentages.
Count the number of values in the data set that are less than 10.
The values less than 10 are: $3, 3, 4, 5, 6, 7, 8, 9$. There are 8 such values.
Calculate the probability as a fraction.
Convert the probability to a percentage.
The probability of choosing a value less than 10 is .
Part d8
Determine the Middle Value of the data set.
The data set is already sorted
.
The number of data points is .Find the position of the middle value (median) using the formula .
The value in the sorted data set is 8.
The middle value of the data set is .
Part e18
Determine the gap between the highest value and the lowest value.
Identify the highest and lowest values in the data set.
Highest value = 21
Lowest value = 3Calculate the difference between the highest and lowest values.
The gap between the highest and lowest value is .
Try one yourself
A new problem that tests the same skill.
Still stuck on this one?
Ask a follow-up, and the answer starts from this question.
More Mathematics Questions
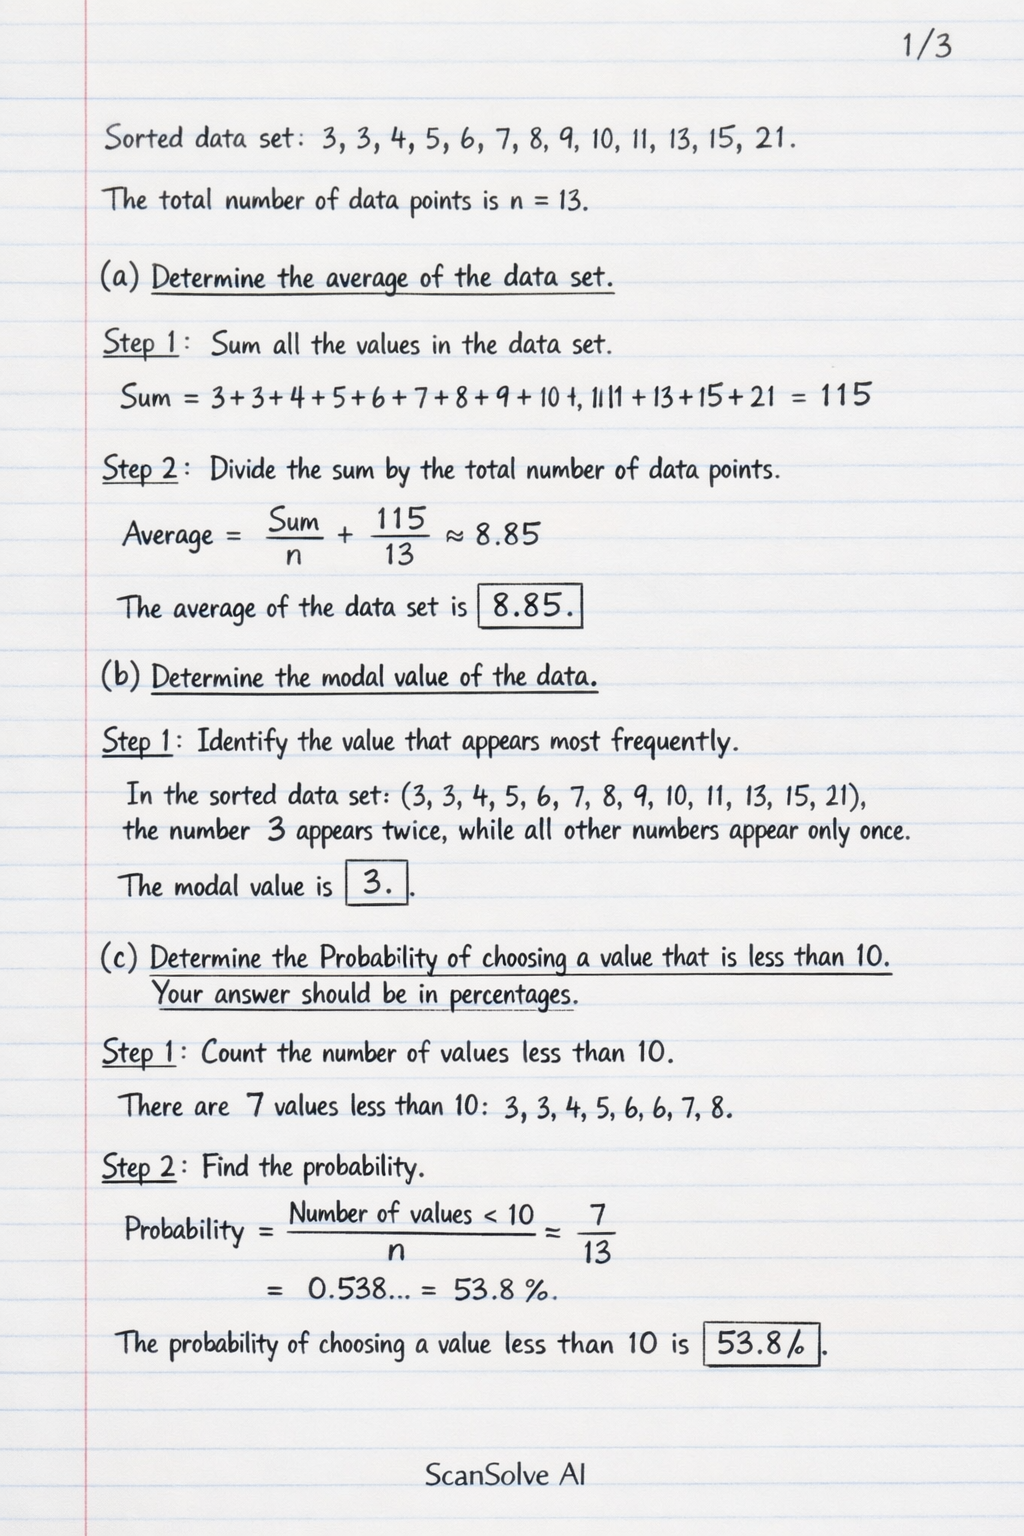
Handwritten Step-by-Step Solution
Get this as a handwritten image on WhatsApp — like a tutor wrote it for you.
Try on WhatsApp