
We read your photo as:
Given the equation y = 4x − 3, complete the table and plot the graph.
ScanSolve AI Answer
Use the left and right arrow keys to trace the curve, up and down to jump between key points, and plus and minus to zoom.
| Point | x | y |
|---|---|---|
| y-intercept | 0 | −3 |
| x-intercept | 0.75 | 0 |
Step-by-step solution
3 steps3.3
Given the equation , we will complete the table by substituting each value into the equation to find the corresponding value.
Calculate for each value.
For :
For :
For :
For :
For :
For :
For :
Complete the table.
-3 -2 -1 0 1 2 3 -15 -11 -7 -3 1 5 9 Plot the graph.
To plot the graph, you would use the coordinate pairs from the table:
, , , , , , .
Plot each of these points on a coordinate plane. Since the equation is a linear equation, all these points will lie on a straight line. Draw a straight line connecting these points to represent the graph of the function.
Still stuck on this one?
Ask a follow-up, and the answer starts from this question.
More Mathematics Questions
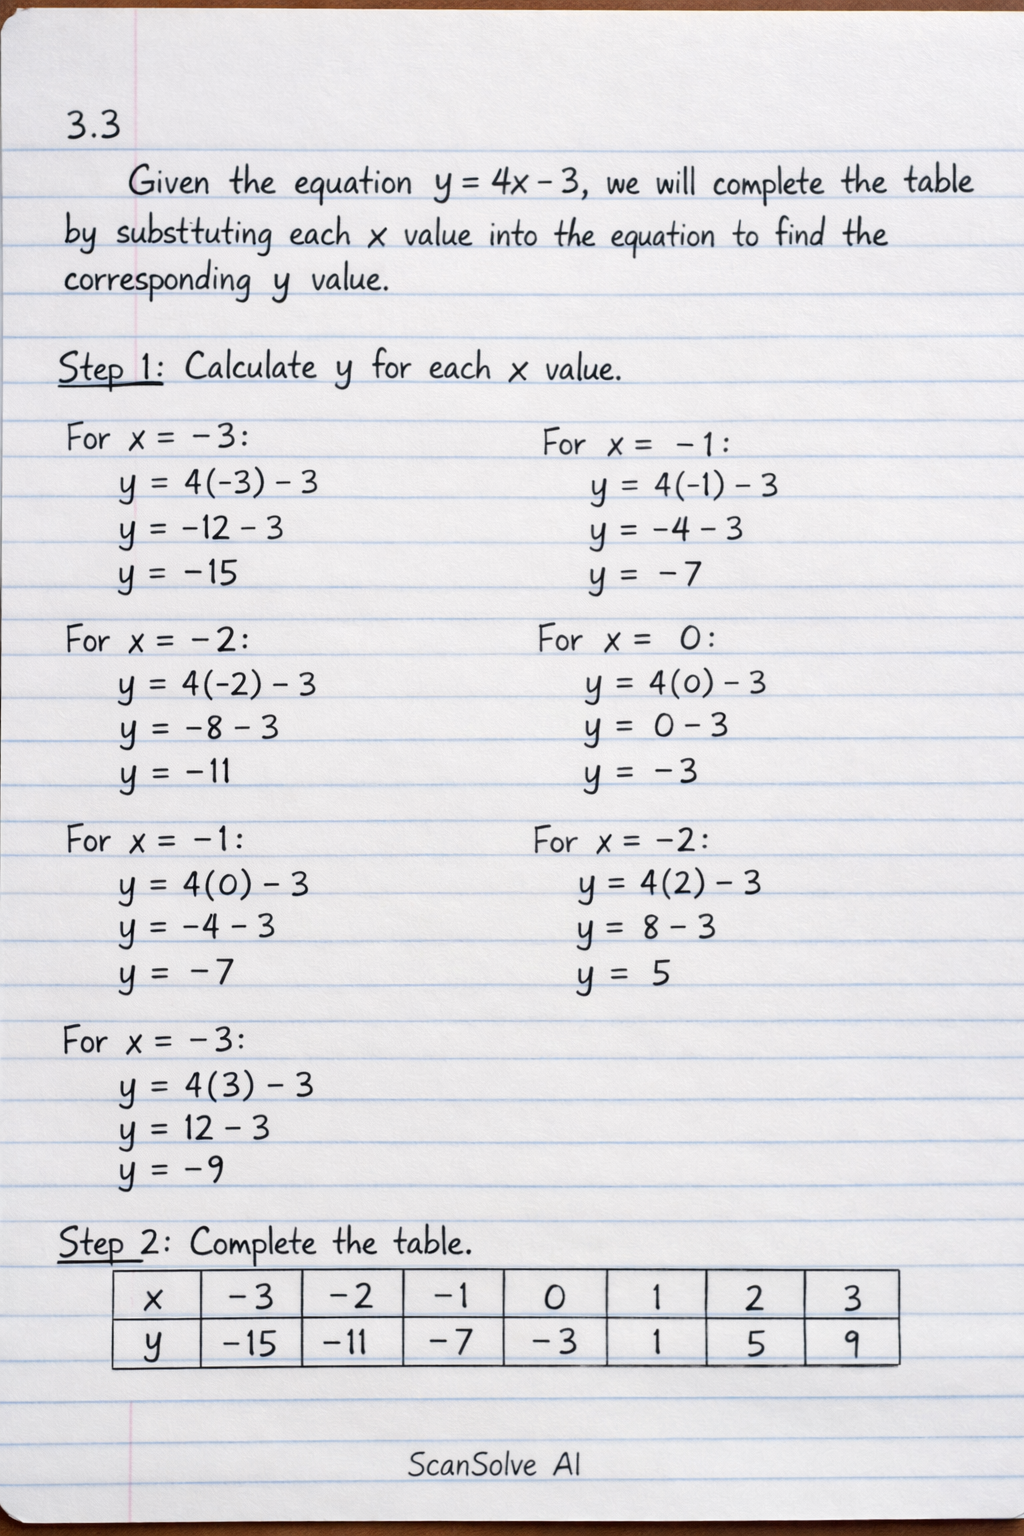
Handwritten Step-by-Step Solution
Get this as a handwritten image on WhatsApp — like a tutor wrote it for you.
Try on WhatsApp