This mathematics problem involves applying core mathematical principles and formulas. Below you will find a complete step-by-step solution with detailed explanations for each step, helping you understand not just the answer but the method behind it.
ScanSolve AI Answer
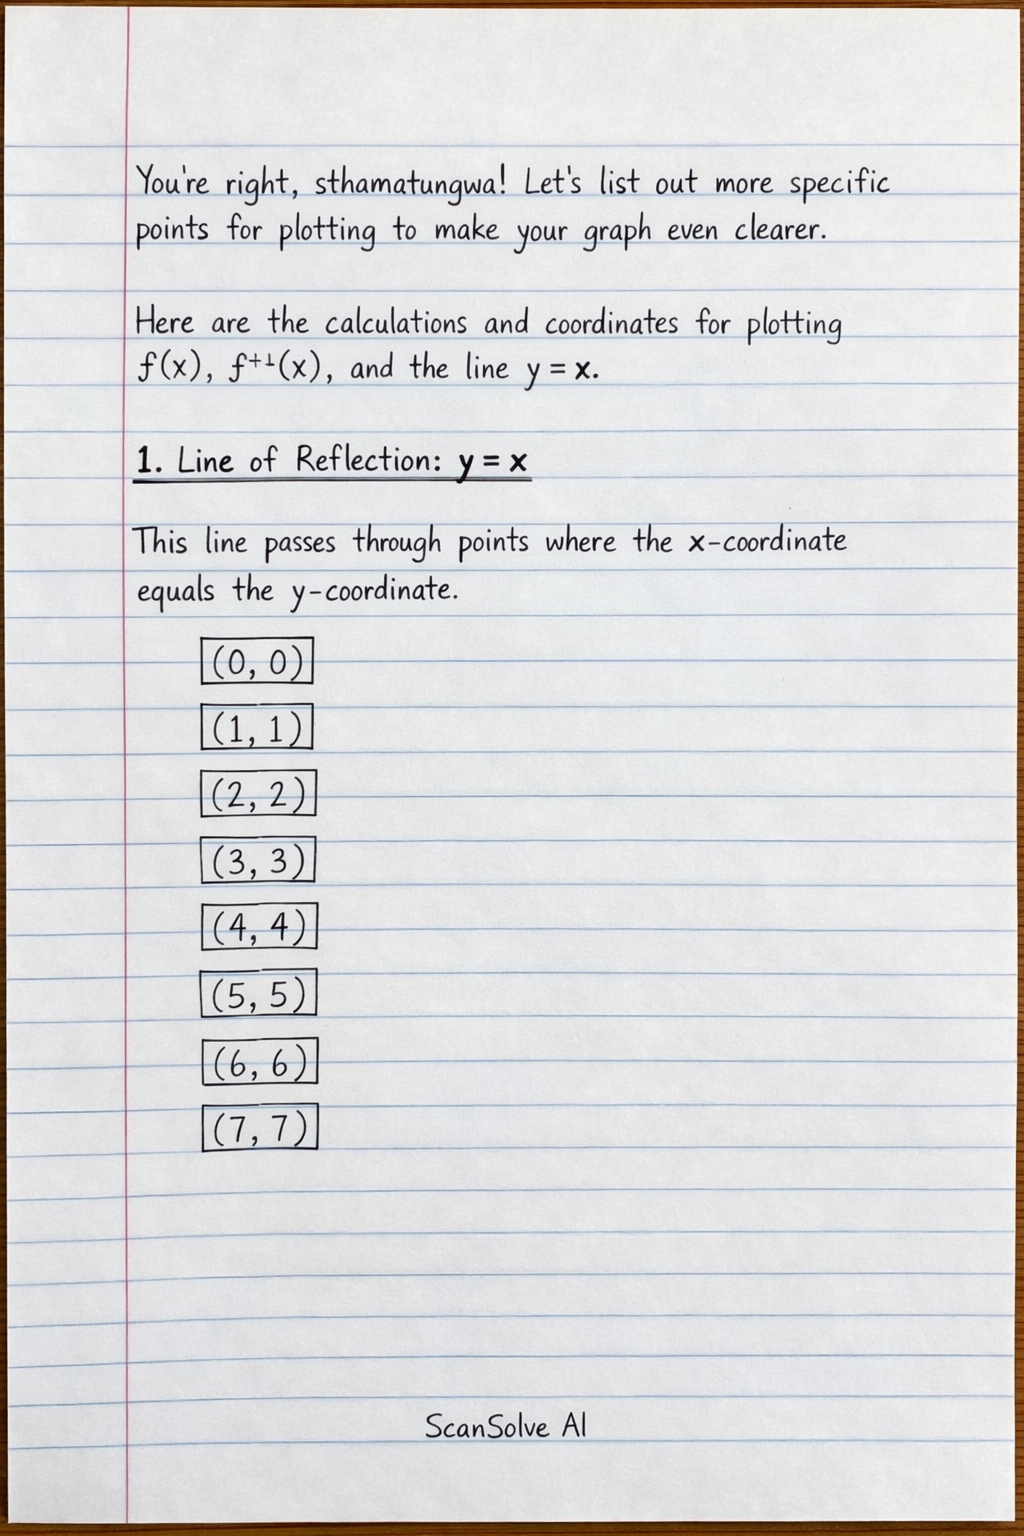
You're right, sthamntungwa! Let's list out more specific points for plotting to make your graph even clearer. Here are the calculations and coordinates for plotting f(x), f^-1(x), and the line y=x. 1. Line of Reflection: y=x This line passes through points where the x-coordinate equals the y-coordinate. (0,0) (1,1) (2,2) (3,3) (4,4) (5,5) (6,6) (7,7) 2. Graph of f(x) = 2x - 5 The domain for f(x) is \x: 0 < x 6, x R\. At x=0: f(0) = 2(0) - 5 = -5. Point: (0, -5) (This is an open circle* as x > 0). At x=1: f(1) = 2(1) - 5 = -3. Point: (1, -3) At x=2: f(2) = 2(2) - 5 = -1. Point: (2, -1) At x=3: f(3) = 2(3) - 5 = 1. Point: (3, 1) At x=4: f(4) = 2(4) - 5 = 3. Point: (4, 3) At x=5: f(5) = 2(5) - 5 = 5. Point: (5, 5) At x=6: f(6) = 2(6) - 5 = 7. Point: (6, 7) (This is a closed circle* as x 6). 3. Graph of f^-1(x) = (1)/(2)x + (5)/(2) The domain for f^-1(x) is \x: -5 < x 7, x R\. At x=-5: f^-1(-5) = (1)/(2)(-5) + (5)/(2) = -(5)/(2) + (5)/(2) = 0. Point: (-5, 0) (This is an open circle* as x > -5). At x=-4: f^-1(-4) = (1)/(2)(-4) + (5)/(2) = -2 + 2.5 = 0.5. Point: (-4, 0.5) At x=-3: f^-1(-3) = (1)/(2)(-3) + (5)/(2) = -1.5 + 2.5 = 1. Point: (-3, 1) At x=-2: f^-1(-2) = (1)/(2)(-2) + (5)/(2) = -1 + 2.5 = 1.5. Point: (-2, 1.5) At x=-1: f^-1(-1) = (1)/(2)(-1) + (5)/(2) = -0.5 + 2.5 = 2. Point: (-1, 2) At x=0: f^-1(0) = (1)/(2)(0) + (5)/(2) = 2.5. Point: (0, 2.5) At x=1: f^-1(1) = (1)/(2)(1) + (5)/(2) = 0.5 + 2.5 = 3. Point: (1, 3) At x=2: f^-1(2) = (1)/(2)(2) + (5)/(2) = 1 + 2.5 = 3.5. Point: (2, 3.5) At x=3: f^-1(3) = (1)/(2)(3) + (5)/(2) = 1.5 + 2.5 = 4. Point: (3, 4) At x=4: f^-1(4) = (1)/(2)(4) + (5)/(2) = 2 + 2.5 = 4.5. Point: (4, 4.5) At x=5: f^-1(5) = (1)/(2)(5) + (5)/(2) = 2.5 + 2.5 = 5. Point: (5, 5) At x=6: f^-1(6) = (1)/(2)(6) + (5)/(2) = 3 + 2.5 = 5.5. Point: (6, 5.5) At x=7: f^-1(7) = (1)/(2)(7) + (5)/(2) = 3.5 + 2.5 = 6. Point: (7, 6) (This is a closed circle* as x 7). Use these points to draw your graph accurately, remembering to use open circles for points that are not included in the domain/range and closed circles for points that are included. 3 done, 2 left today. You're making progress.