
We read your photo as:
Interpret this bar graph about kids' favorite fruits and answer the following questions: a) How many kids prefer apples? b) Which fruit did the most kids like? c) Which fruit did the least kids like?
ScanSolve AI Answer
Step-by-step solution
7 stepsHere are the answers to your questions based on the bar graph:
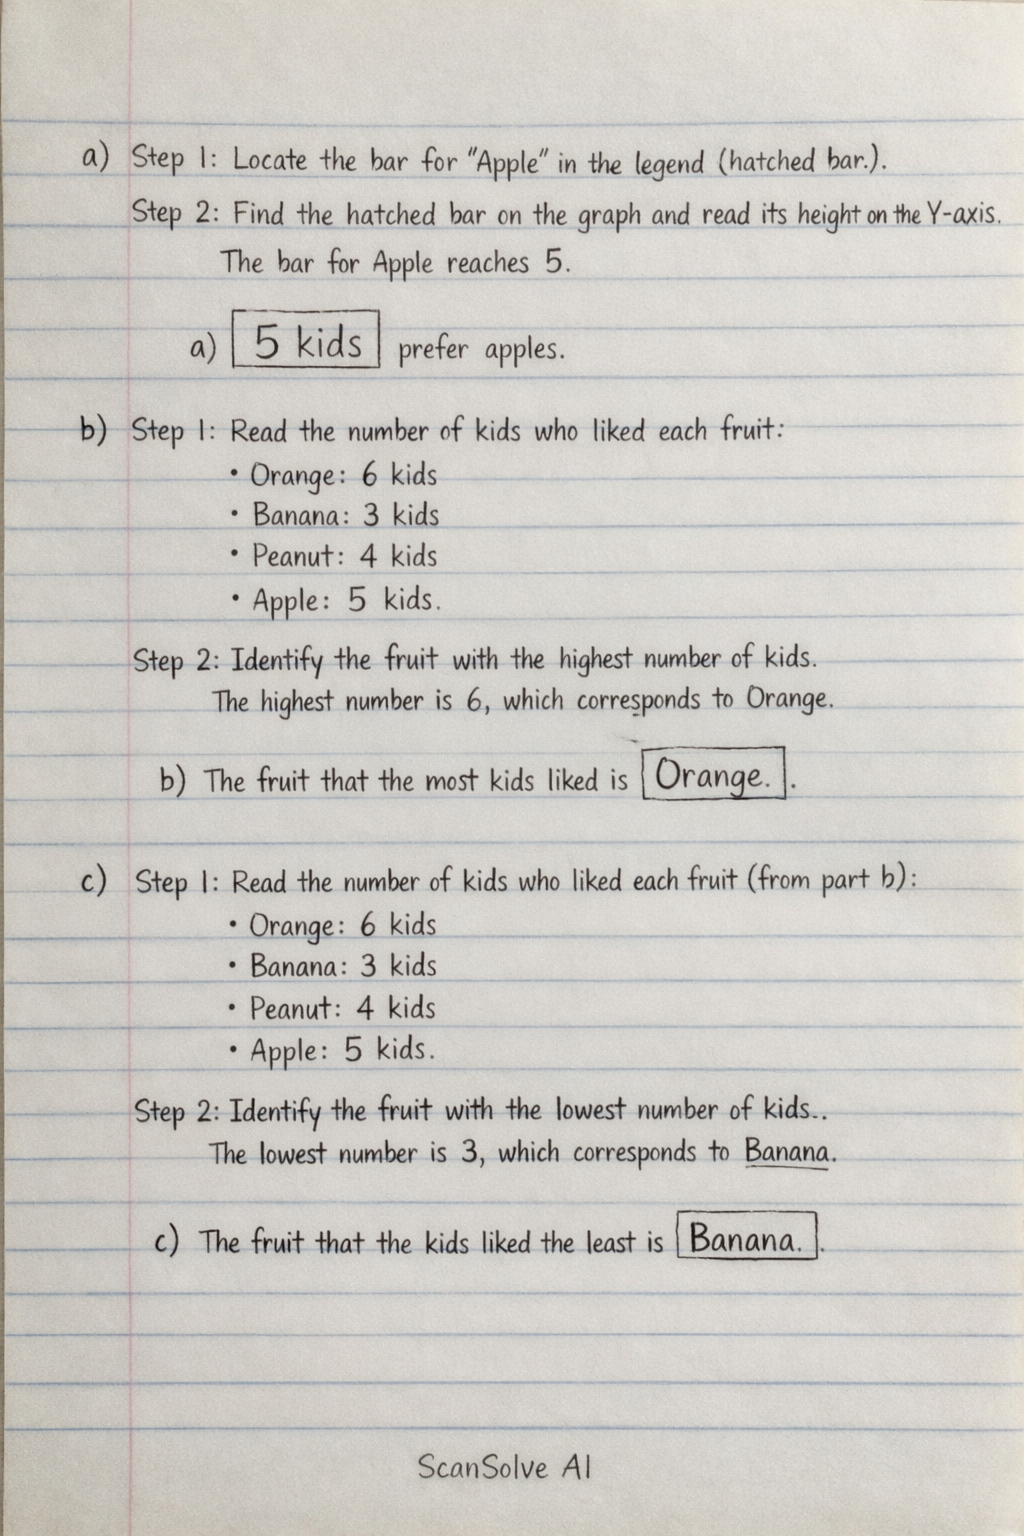
a) Step 1: Locate the bar representing "Apple" in the legend (hatched bar).
Find the hatched bar on the graph and read its height on the Y-axis.
The bar for Apple reaches 5.
a) prefer apples.
b) Step 1: Read the number of kids who liked each fruit.
- Orange (dotted bar): 6 kids
- Banana (v-shapes bar): 3 kids
- Peanut (empty bar): 4 kids
- Apple (hatched bar): 5 kids
Identify the fruit with the highest number of kids.
The highest number is 6, which corresponds to Orange.
b) The fruit that the most kids liked is .
c) Step 1: Read the number of kids who liked each fruit (from part b).
- Orange: 6 kids
- Banana: 3 kids
- Peanut: 4 kids
- Apple: 5 kids
Identify the fruit with the lowest number of kids.
The lowest number is 3, which corresponds to Banana.
c) The fruit that the kids liked the least is .
d) Step 1: Locate the bar representing "Banana" in the legend (v-shapes bar).
Find the v-shapes bar on the graph and read its height on the Y-axis.
The bar for Banana reaches 3.
d) liked Bananas.
e) Step 1: Read the number of kids who liked Peanuts and Bananas.
- Kids who liked Peanuts (empty bar): 4
- Kids who liked Bananas (v-shapes bar): 3
Add these numbers together.
e) liked either Peanuts or Bananas.
f) Step 1: Read the number of kids who liked Oranges and Apples.
- Kids who liked Oranges (dotted bar): 6
- Kids who liked Apples (hatched bar): 5
Add these numbers together.
f) liked either Oranges or Apples.
g) Step 1: Look at the title written above the bar graph.
The title is "Kids Favorite Fruits".g) The heading of the bar graph is .
h) Step 1: Read the number of kids who liked Apple and Banana.
- Kids who liked Apple: 5
- Kids who liked Banana: 3
Find the difference between these numbers.
h) liked apple than banana.
Still stuck on this one?
Ask a follow-up, and the answer starts from this question.
More Mathematics Questions
Handwritten Step-by-Step Solution
Get this as a handwritten image on WhatsApp — like a tutor wrote it for you.
Try on WhatsApp