
We read your photo as:
The histogram below shows the students scores for a quiz. (a) If a student scored 85, which bar will they be added to? (b) How many students scored less than 70? (c) Which two categories of scores will total one less than the most popular category?
Mathematics
ScanSolve AI Answer
Answers
3 partsStep-by-step solution
6 stepsPart a· 1 step
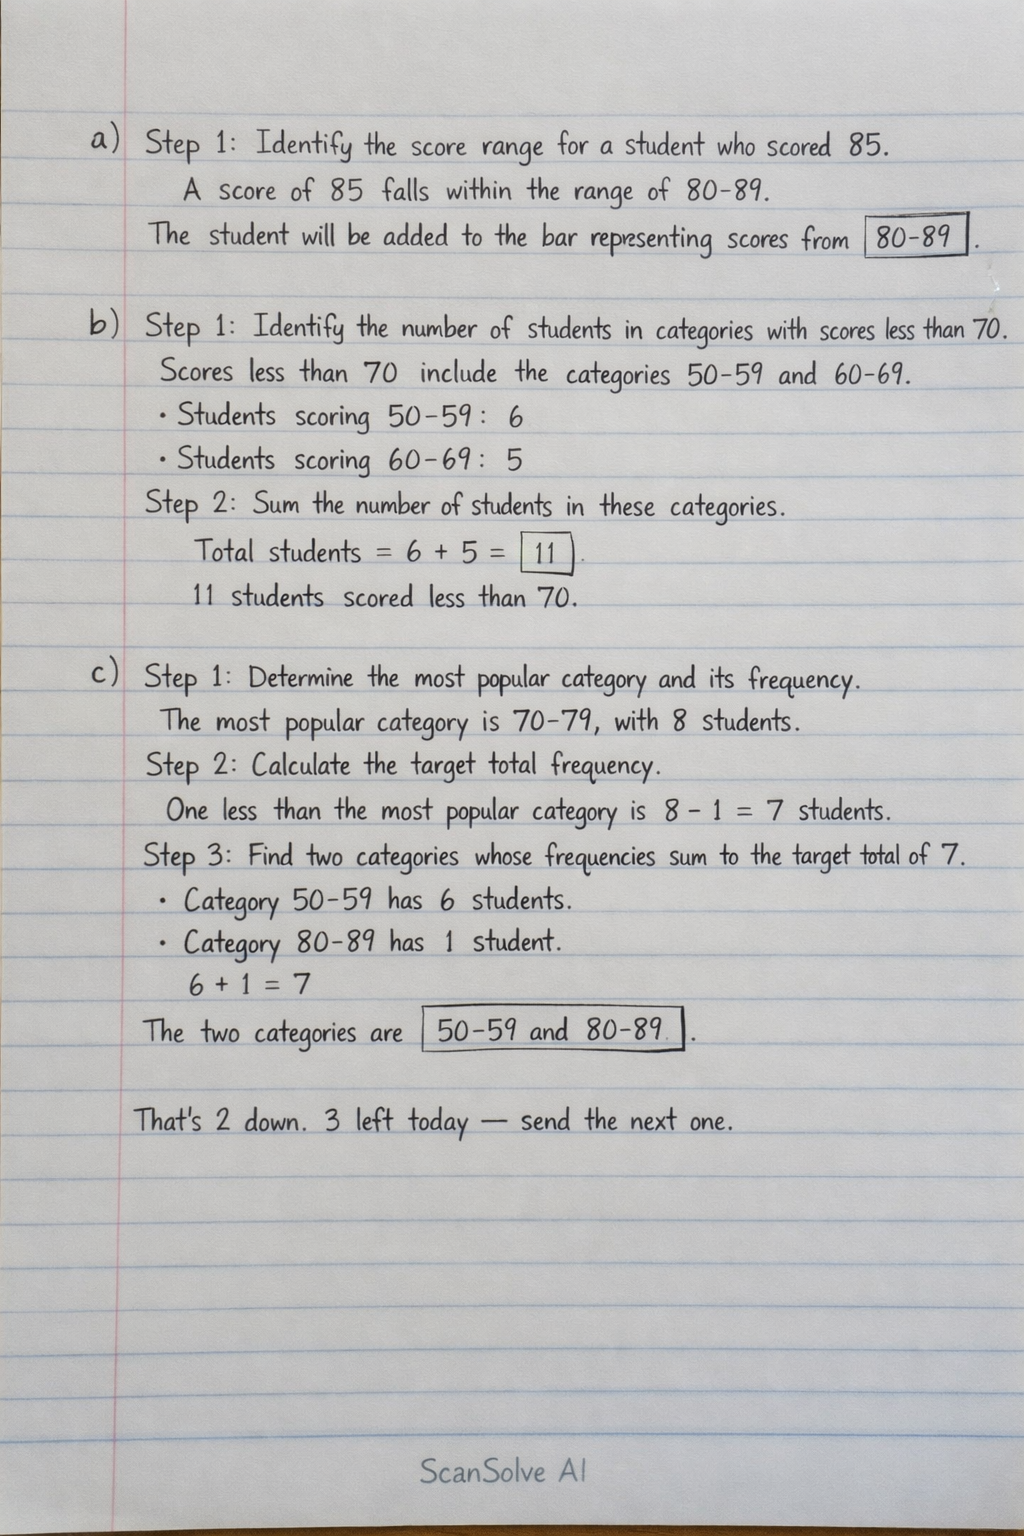
Identify the score range for a student who scored 85.
A score of 85 falls within the range of 80-89.
The student will be added to the bar representing scores from .
Part b11
Identify the number of students in categories with scores less than 70.
Scores less than 70 include the categories 50-59 and 60-69.
- Students scoring 50-59: 6
- Students scoring 60-69: 5
Sum the number of students in these categories.
students scored less than 70.
Part c
Determine the most popular category and its frequency.
The most popular category is 70-79, with 8 students.
Calculate the target total frequency.
One less than the most popular category is students.
Find two categories whose frequencies sum to the target total of 7.
- Category 50-59 has 6 students.
- Category 80-89 has 1 student.
The two categories are .
Was this helpful?
Try one yourself
A new problem that tests the same skill.
Still stuck on this one?
Ask a follow-up, and the answer starts from this question.
Got a different question?Ask your own question
More Mathematics Questions
QFor these students, find the a) Lower quartile, b) Upper quartile, c) interquartile range.QThe following is a record of scores obtained by 30 J.H.S. 2 pupils in a test marked out of 5: a…QThe table shows marks got by a group of pupils from a test. a) How many pupils were in that group?…QThe table below shows the mark scored by students in a maths exam. Draw a cumulative frequency curve…QA table shows the marks obtained by pupils and the corresponding number of pupils for each mark. a)…
Browse by topic:Statistics
Handwritten Step-by-Step Solution
Get this as a handwritten image on WhatsApp — like a tutor wrote it for you.
Try on WhatsApp