
We read your photo as:
Refer to the given graph below to answer Questions 3 and 4. FAVORITE SPORTS OF MALE SENIOR HIGH STUDENTS. What kind of graph is shown above? How many students like soccer than basketball?
ScanSolve AI Answer
Step-by-step solution
6 stepsAnswer Question 1.
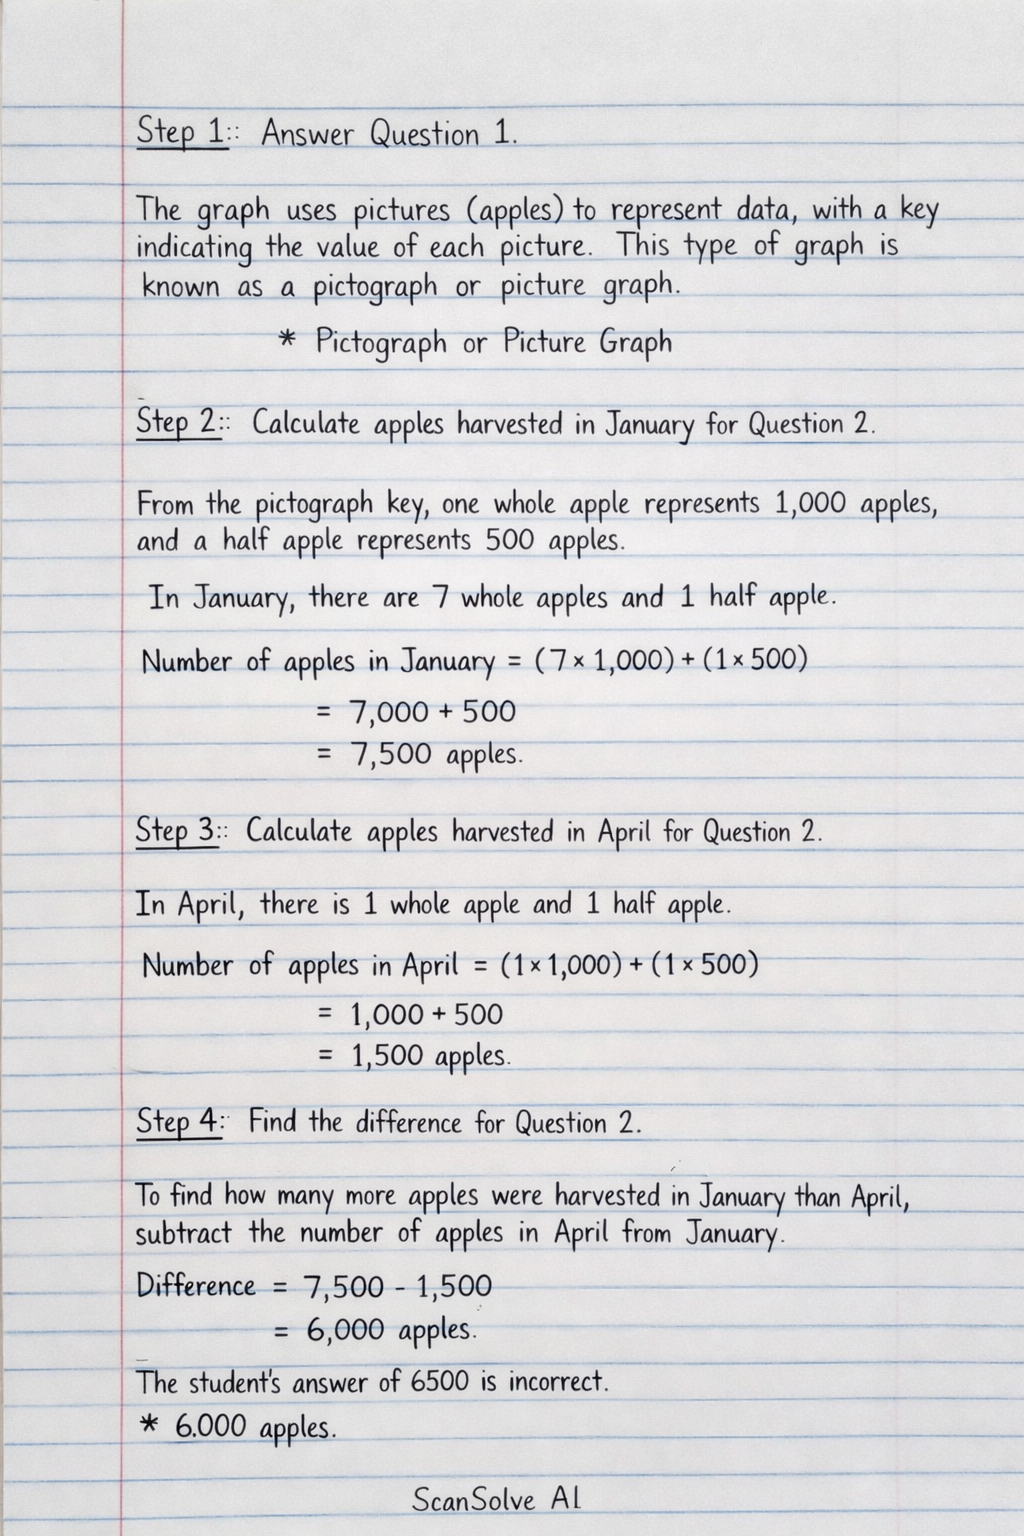
The graph uses pictures (apples) to represent data, with a key indicating the value of each picture. This type of graph is known as a pictograph or picture graph.
- Pictograph or Picture Graph
Calculate apples harvested in January for Question 2.
From the pictograph key, one whole apple represents 1,000 apples, and a half apple represents 500 apples.
In January, there are 7 whole apples and 1 half apple.
Number of apples in January = apples.Calculate apples harvested in April for Question 2.
In April, there is 1 whole apple and 1 half apple.
Number of apples in April = apples.Find the difference for Question 2.
To find how many more apples were harvested in January than April, subtract the number of apples in April from January.
Difference = apples.
The student's answer of 6500 is incorrect.- 6,000 apples
Answer Question 3.
The graph uses bars of different heights to represent the frequency of favorite sports among male senior high students. This type of graph is called a bar graph.
- Bar Graph
Answer Question 4.
The question "How many students like soccer than basketball?" is likely asking for the difference in the number of students who prefer soccer compared to basketball.
From the bar graph:- Number of students who like Soccer = 70
- Number of students who like Basketball = 50 Difference = students.
- 20 students
Still stuck on this one?
Ask a follow-up, and the answer starts from this question.
More Mathematics Questions
Handwritten Step-by-Step Solution
Get this as a handwritten image on WhatsApp — like a tutor wrote it for you.
Try on WhatsApp