This mathematics problem involves applying core mathematical principles and formulas. Below you will find a complete step-by-step solution with detailed explanations for each step, helping you understand not just the answer but the method behind it.
ScanSolve AI Answer
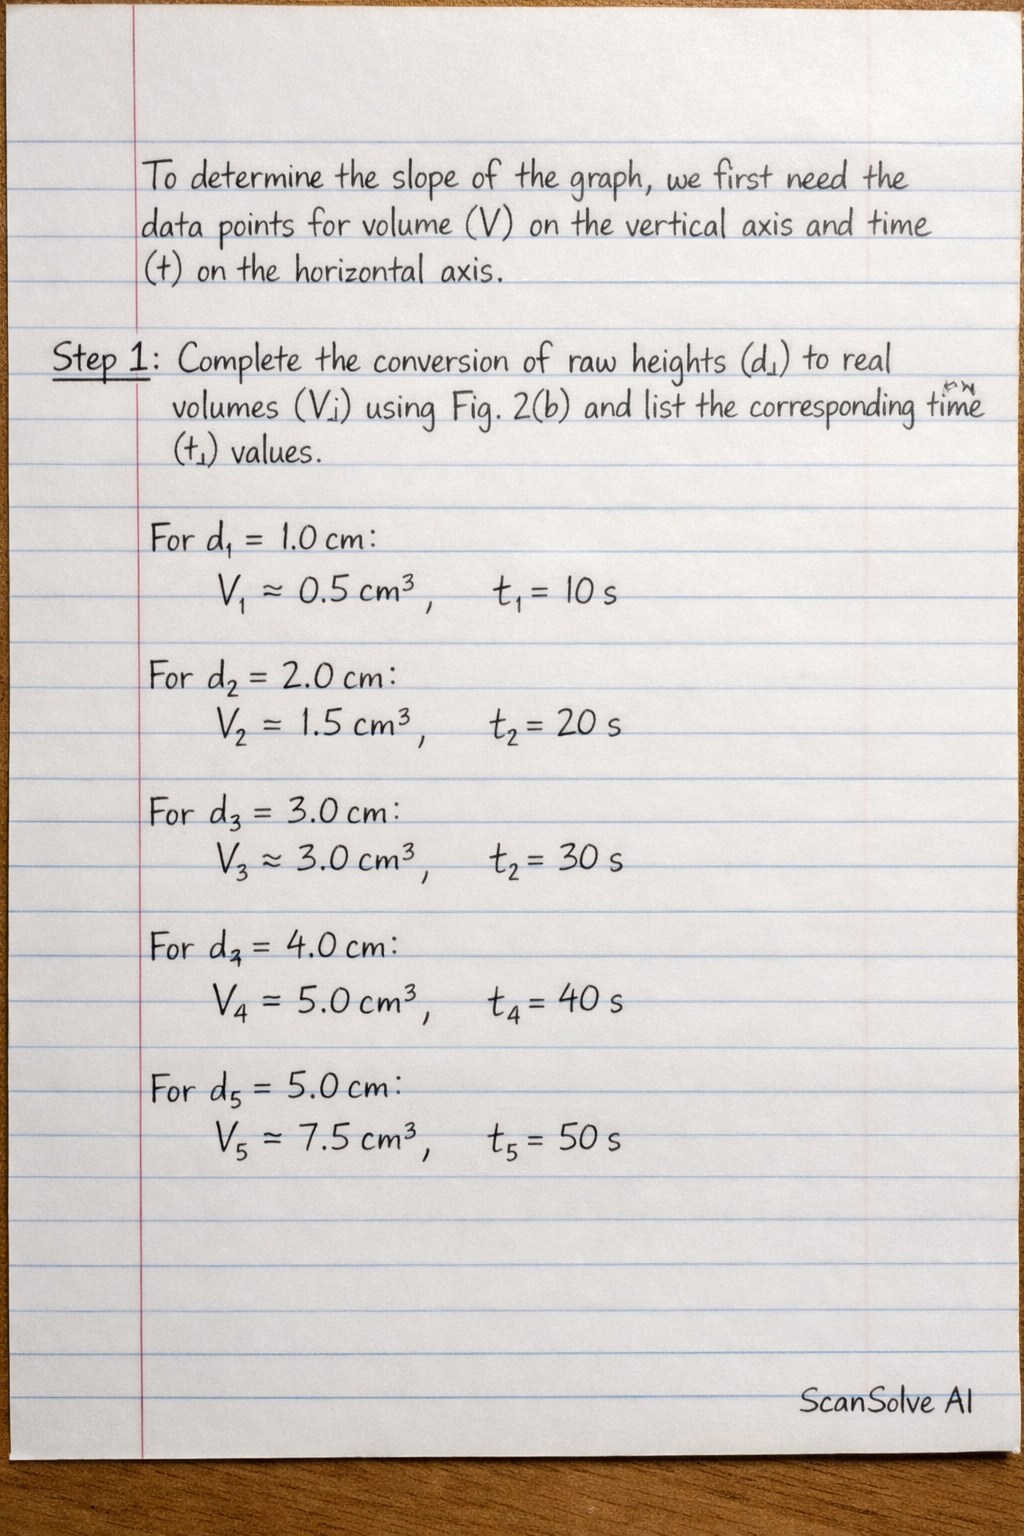
To determine the slope of the graph, we first need the data points for volume (V) on the vertical axis and time (t) on the horizontal axis. Step 1: Complete the conversion of raw heights (d_i) to real volumes (V_i) using Fig. 2(b) and list the corresponding time (t_i) values from the table in Fig. 2(a). From the previous steps, we have: • For d_1 = 1.0 cm, V_1 ≈ 0.5 cm^3. The corresponding time is t_1 = 10 s. • For d_2 = 2.0 cm, V_2 ≈ 1.5 cm^3. The corresponding time is t_2 = 20 s. • For d_3 = 3.0 cm, V_3 ≈ 3.0 cm^3. The corresponding time is t_3 = 30 s. • For d_4 = 4.0 cm, V_4 ≈ 5.0 cm^3. The corresponding time is t_4 = 40 s. • For d_5 = 5.0 cm, V_5 ≈ 7.5 cm^3. The corresponding time is t_5 = 50 s. The data points for the graph with V on the vertical axis and t on the horizontal axis are: (10 s, 0.5 cm^3), (20 s, 1.5 cm^3), (30 s, 3.0 cm^3), (40 s, 5.0 cm^3), (50 s, 7.5 cm^3) Step 2: Determine the slope of the graph. The slope of a V vs t graph represents the rate of change of volume with respect to time. Since the relationship between V and t is not perfectly linear, we will calculate the average slope using the first and last data points. The formula for the slope (m) is: m = ( V)/( t) = (V_5 - V_1)/(t_5 - t_1) Substitute the values: m = 7.5 cm^3 - 0.5 cm^350 s - 10 s m = 7.0 cm^340 s m = 0.175 cm^3/s The slope of the graph is 0.175 cm^3/s. 3 done, 2 left today. You're making progress.