
We read your photo as:
Calculate the Spearman rank correlation coefficient for the given height and mass data. Show your steps.
ScanSolve AI Answer
Answer
Here are the solutions to your questions:
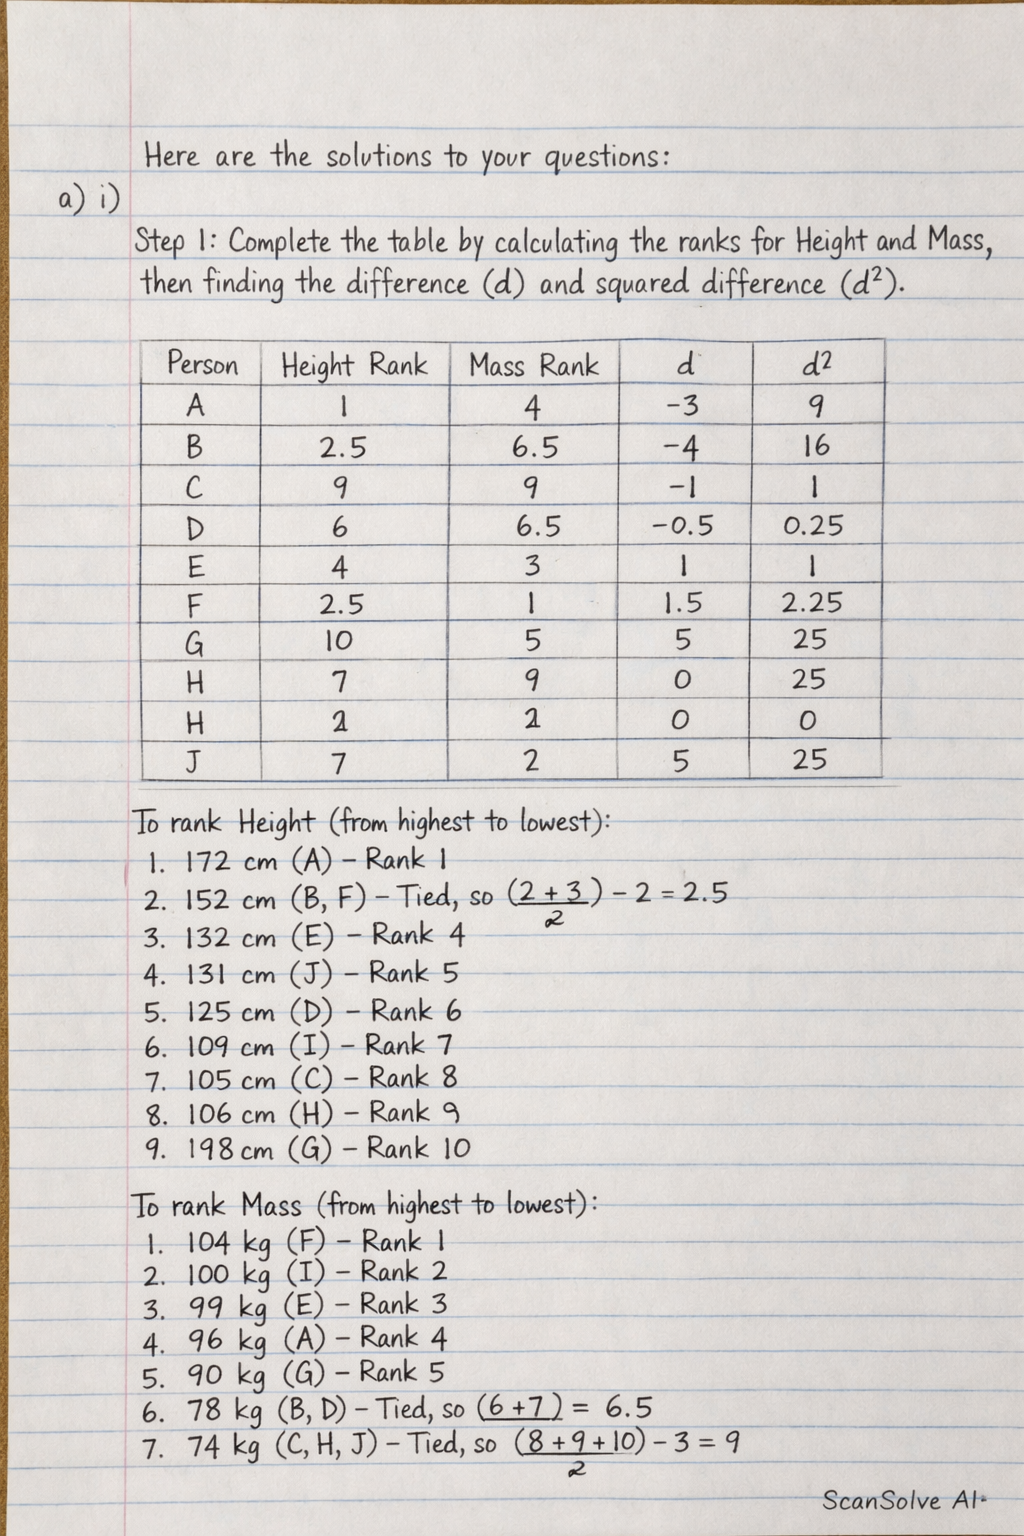
a) i) Step 1: Complete the table by calculating the ranks for Height and Mass, then finding the difference () and squared difference ().
To rank Height (from highest to lowest):
- (A) - Rank 1
- (B, F) - Tied, so average of ranks 2 and 3 is 2.5
- (E) - Rank 4
- (J) - Rank 5
- (D) - Rank 6
- (I) - Rank 7
- (C) - Rank 8
- (H) - Rank 9
- (G) - Rank 10
To rank Mass (from highest to lowest):
- (F) - Rank 1
- (I) - Rank 2
- (E) - Rank 3
- (A) - Rank 4
- (G) - Rank 5
- (B, D) - Tied, so average of ranks 6 and 7 is 6.5
- (C, H, J) - Tied, so average of ranks 8, 9, and 10 is 9
Now, complete the table:
ii) Step 2: Determine the level of correlation using Spearman's Rank Correlation Coefficient formula and state its significance.
The formula for Spearman's Rank Correlation Coefficient () is:
Given and .
Substitute the values into the formula:
The level of correlation is approximately .
Significance: This indicates a moderate positive correlation between height and mass. This means that generally, as height increases, mass tends to increase, but the relationship is not very strong.
b) i) Step 3: To represent the information using a Climograph:
- Draw a horizontal axis (x-axis) for the months (J, F, M, A, M, J, J, A, S, O, N, D).
- Draw a primary vertical axis (y-axis) on the left for Temperature in . Plot the monthly temperature values as a line graph.
- Draw a secondary vertical axis (y-axis) on the right for Rainfall in . Plot the monthly rainfall values as a bar graph.
- Ensure the scales for both vertical axes are appropriate to display the data clearly.
ii) Step 4: Another appropriate technique to represent the data is a double-axis graph where temperature is shown as a line graph and rainfall as a bar graph, sharing the same x-axis (months) but having separate y-axes for their respective units.
c) i) Step 5: To construct a flow line map/chart:
- Obtain a map of Cameroon that clearly shows the locations of Bamenda, Yaounde, Douala, Buea, and Ngaoundere.
- Draw lines (arrows) originating from Bamenda and pointing towards each destination (Yaounde, Douala, Buea, Ngaoundere).
- The width of each line should be drawn proportional to the number of migrants for that destination. For example, the line to Yaounde (12,000 people) would be the widest, and the line to Buea (2,000 people) would be the narrowest.
ii) Step 6: State one advantage and one disadvantage of using a flow line map:
- Advantage: A flow line map effectively visualizes the direction and magnitude of movement or interaction between locations, making patterns of flow easily discernible.
- Disadvantage: Flow line maps can become cluttered and difficult to interpret if there are many origins, destinations, or complex overlapping flows, especially in areas with high traffic.
Try one yourself
A new problem that tests the same skill.
Still stuck on this one?
Ask a follow-up, and the answer starts from this question.
More Mathematics Questions
Handwritten Step-by-Step Solution
Get this as a handwritten image on WhatsApp — like a tutor wrote it for you.
Try on WhatsApp