
We read your photo as:
Calculate the sum, mean, and sum of squares for each group.
ScanSolve AI Answer
Step-by-step solution
8 stepsHere's the continuation of the solution to your question:
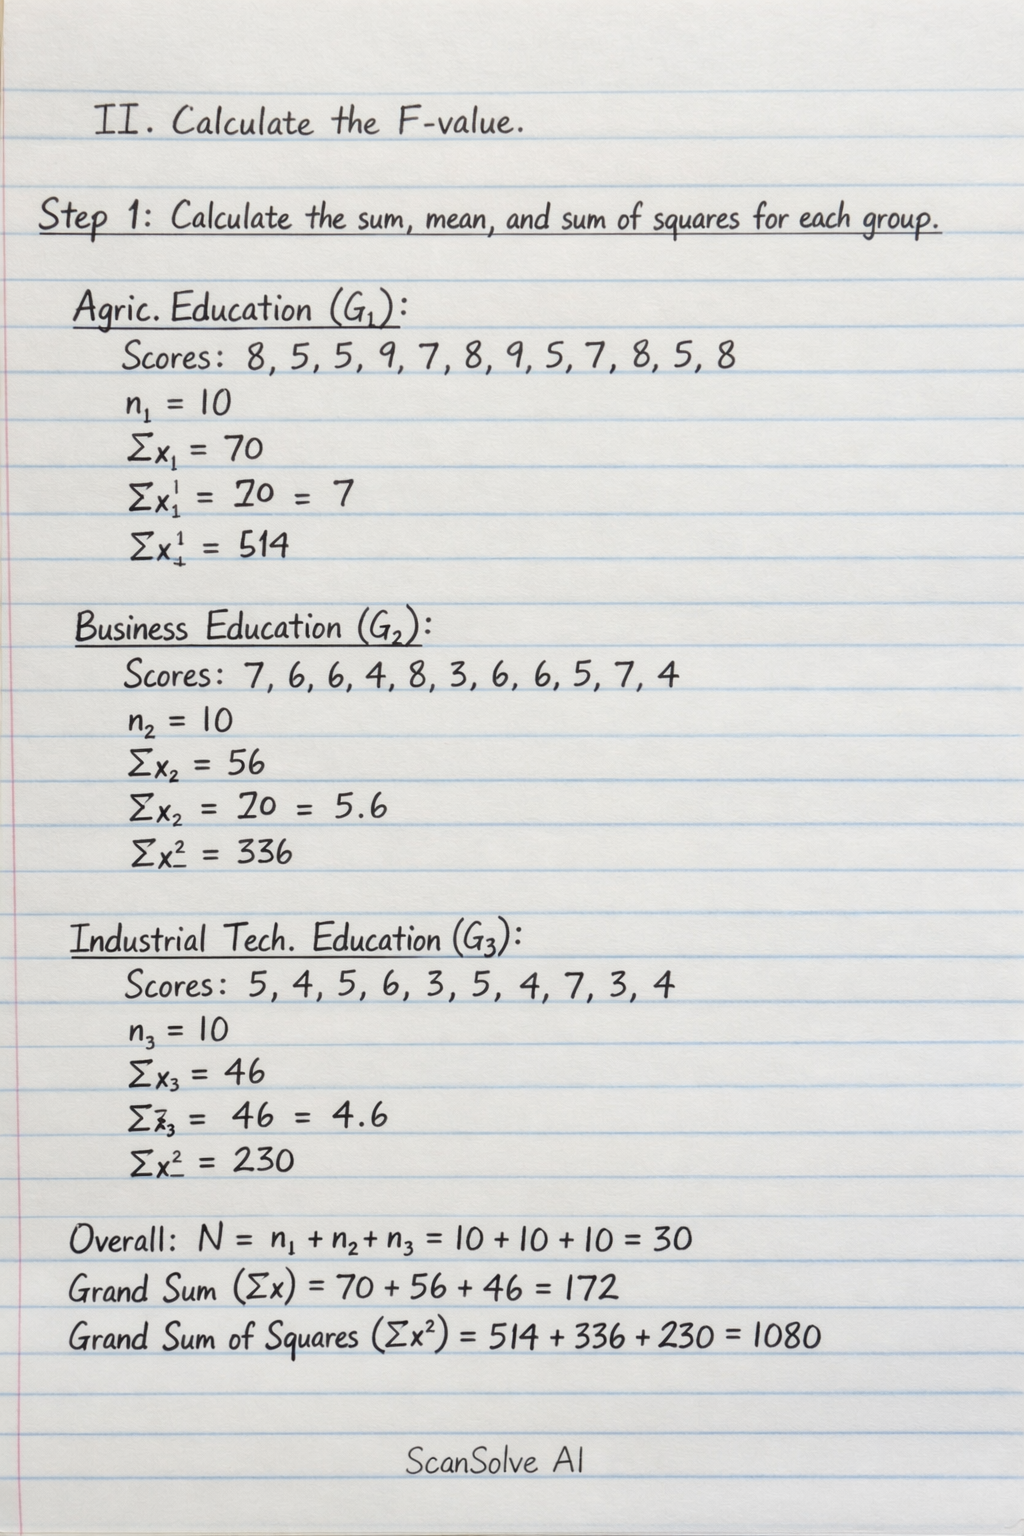
II. Calculate the F-value.
Calculate the sum, mean, and sum of squares for each group.
- Agric. Education (): Scores (8, 5, 5, 9, 7, 8, 9, 5, 6, 8)
- Business Education (): Scores (7, 6, 6, 4, 8, 3, 6, 5, 7, 4)
- Industrial Technical Education (): Scores (5, 4, 5, 6, 3, 5, 4, 7, 3, 4)
Overall:
Grand Sum () =
Grand Sum of Squares () =Calculate the Correction Factor (CF), Total Sum of Squares (SST), Sum of Squares Between Groups (SSB), and Sum of Squares Within Groups (SSW).
- Correction Factor:
- Total Sum of Squares:
- Sum of Squares Between Groups:
- Sum of Squares Within Groups:
Calculate the degrees of freedom.
- Degrees of freedom between groups () =
- Degrees of freedom within groups () =
Calculate the Mean Square Between Groups (MSB) and Mean Square Within Groups (MSW).
- Mean Square Between Groups:
- Mean Square Within Groups:
Calculate the F-value.
The calculated F-value is .
III. What is the F-table value?
Determine the critical F-value from the F-distribution table.
Using , , and :
The F-table value is .IV. What is your decision based on the results?
Compare the calculated F-value with the F-table value.
Since the calculated F-value (6.06) is greater than the critical F-table value (3.35), we reject the null hypothesis.
V. What is your conclusion?
State the conclusion.
There is sufficient evidence to conclude that there is a significant difference in the mean quiz scores among the students in Agric. Education, Business Education, and Industrial Technical Education departments at the 0.05 level of significance.
Still stuck on this one?
Ask a follow-up, and the answer starts from this question.
More Mathematics Questions
Handwritten Step-by-Step Solution
Get this as a handwritten image on WhatsApp — like a tutor wrote it for you.
Try on WhatsApp