
We read your photo as:
To determine the slope of a graph where 'm' is plotted as the abscissa (x-axis) and 'V' is plotted as the ordinate (y-axis).
ScanSolve AI Answer
Step-by-step solution
3 stepsThe question asks to determine the slope of a graph where 'm' is plotted as the abscissa (x-axis) and 'V' is plotted as the ordinate (y-axis).
Understand the graph axes.
The abscissa is the x-axis, so 'm' is on the x-axis.
The ordinate is the y-axis, so 'V' is on the y-axis.Recall the formula for the slope of a line.
The slope () of a straight line passing through two points and is given by:
Apply the formula to the given variables.
In this case, corresponds to 'm' and corresponds to 'V'. So, if you select two points from your graph, and , the slope will be:
To determine the slope, you would select two distinct points on the straight line of your graph, read their corresponding 'm' and 'V' values, and substitute them into this formula.
Since no graph or data points are provided, a numerical value for the slope cannot be calculated. The method to determine the slope is as described above.
Still stuck on this one?
Ask a follow-up, and the answer starts from this question.
More Mathematics Questions
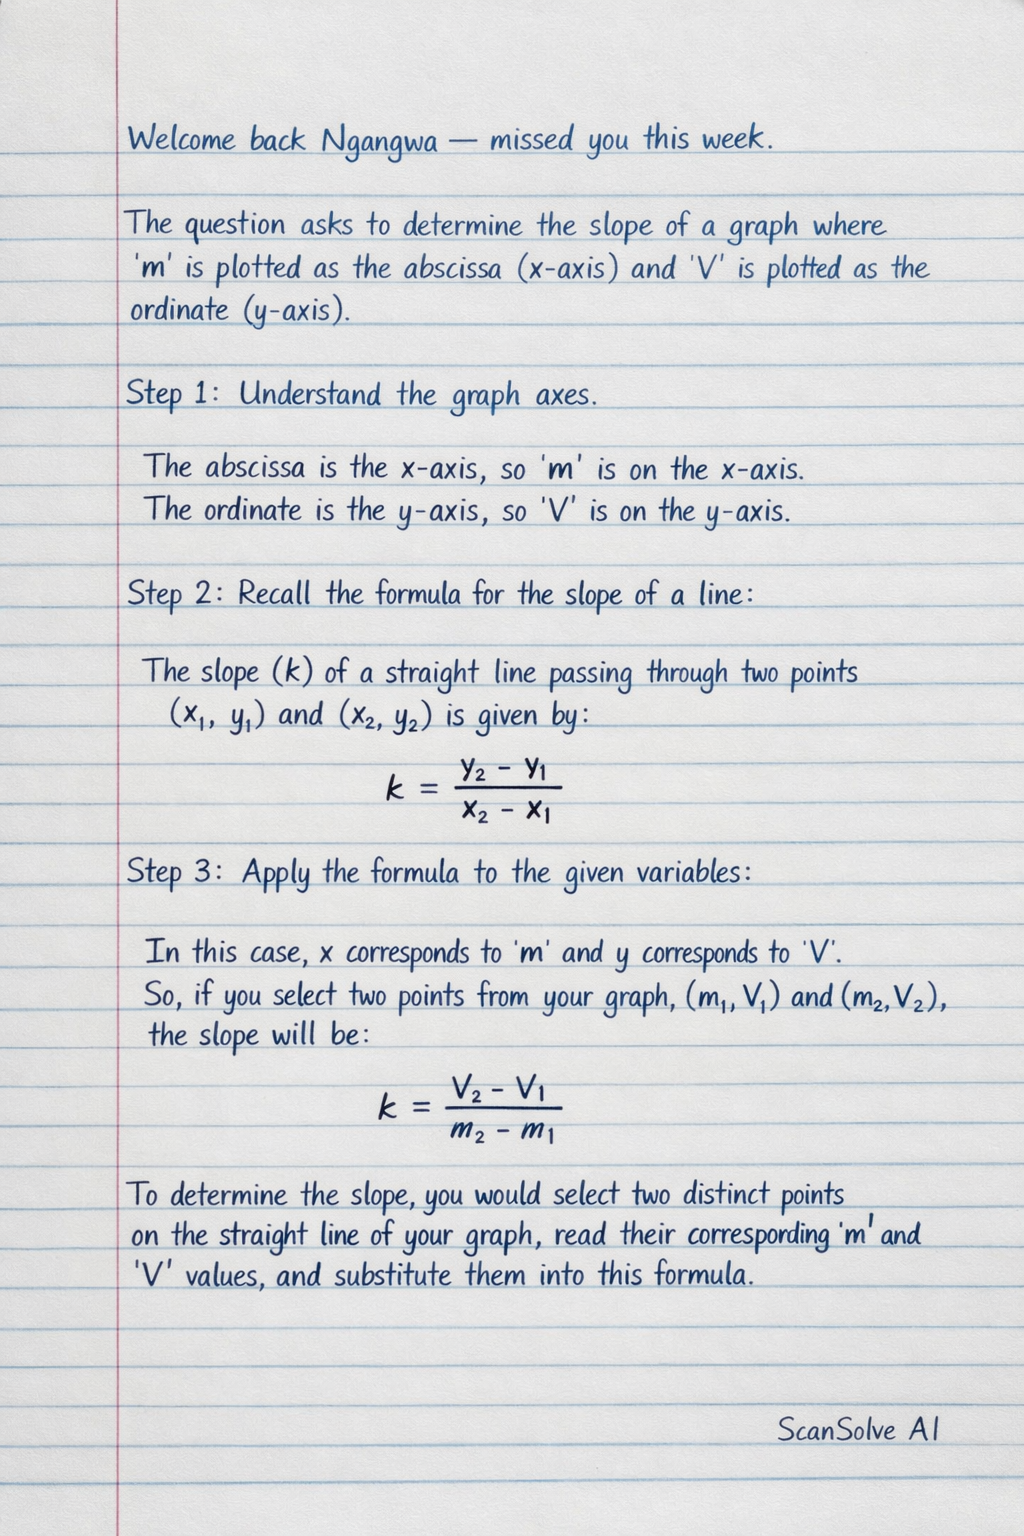
Handwritten Step-by-Step Solution
Get this as a handwritten image on WhatsApp — like a tutor wrote it for you.
Try on WhatsApp