
We read your photo as:
Use TABLE 2 above and match the definitions or explanations with the terminology below. Write only the letter (A-H) next to the question numbers (1.2.1 to 1.2.5), e.g., 1.2.5 J
Mathematics
ScanSolve AI Answer
Here are the matches for the given terminology:
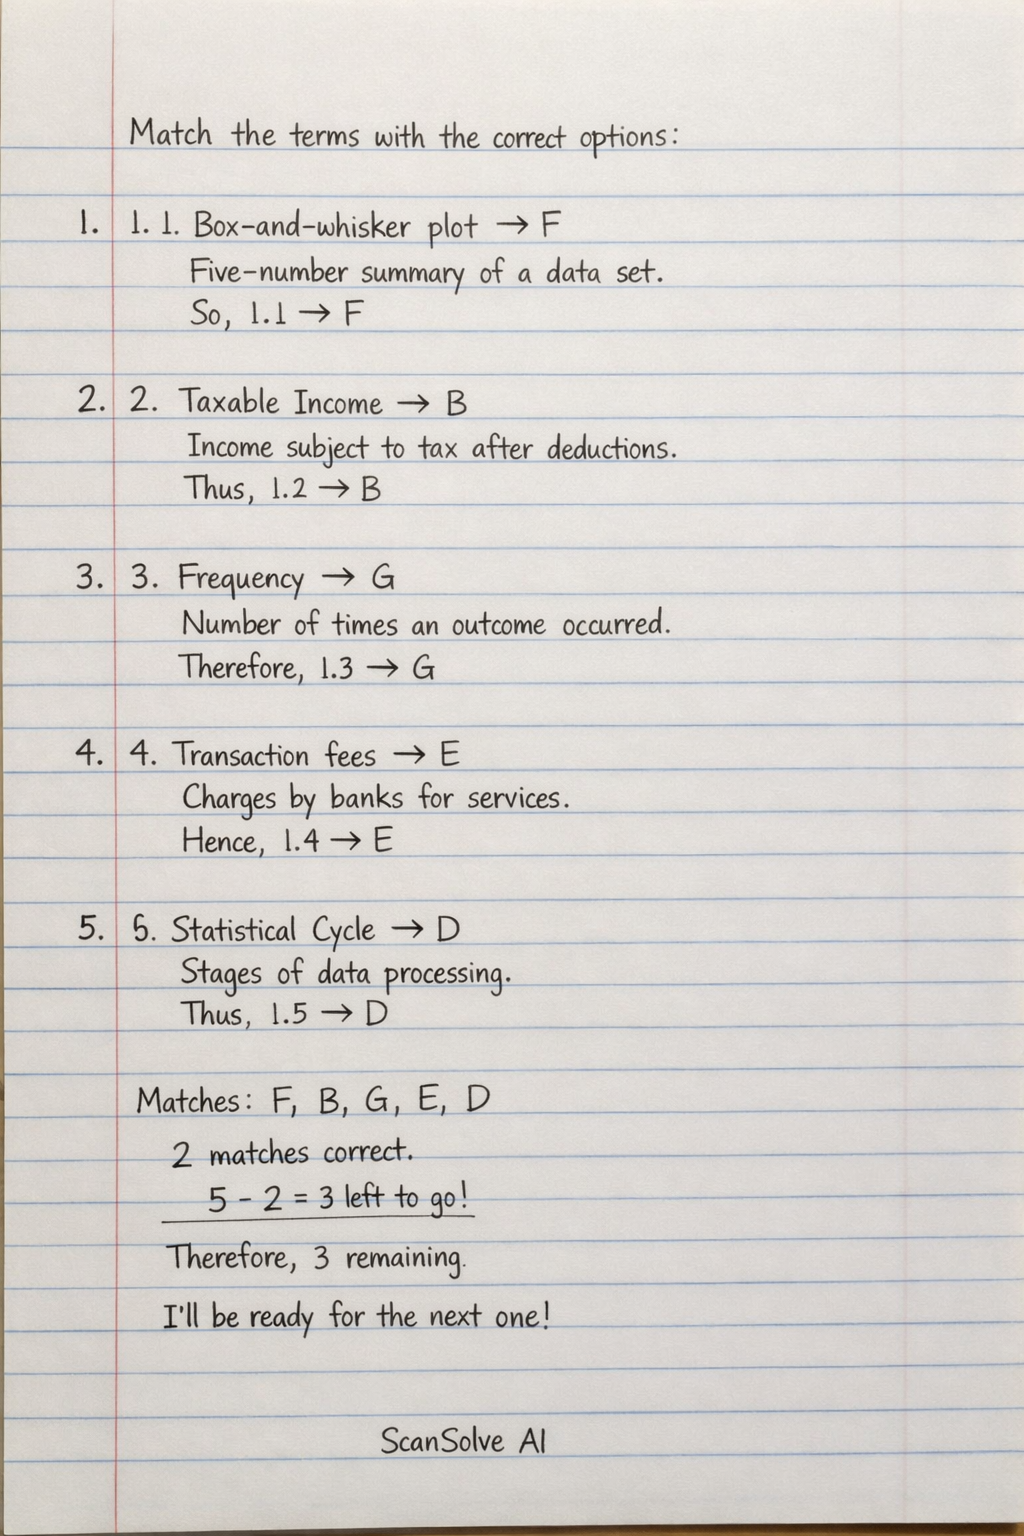
1.2.1 Box-and-whisker plot: This is a diagram that displays the five-number summary of a given data set.
- F
1.2.2 Taxable Income: This is the income that is subject to tax after certain deductions.
- B
1.2.3 Frequency: This refers to the number of times an outcome has occurred.
- G
1.2.4 Transaction fees: These are charges by banks for services they offer.
- E
1.2.5 Statistical Cycle: This refers to the stages involved in data processing.
- D
Was this helpful?
Still stuck on this one?
Ask a follow-up, and the answer starts from this question.
Got a different question?Ask your own question
More Mathematics Questions
QUse TABLE 1 above and match a definition with the terminology below. Write only the letter (A-I)…QUse TABLE 2 above to match the definitions with the terminology below.QMatch the concepts below with the letters in the diagram. Write only the letter (A-H) next to the…QIn TABLE 1 below is a list of explanations and definitions of concepts used in Mathematical…QMatch the terms (1.1.1 to 1.1.5) with the correct definitions (A to I) from TABLE 1.
Handwritten Step-by-Step Solution
Get this as a handwritten image on WhatsApp — like a tutor wrote it for you.
Try on WhatsApp