
We read your photo as:
What do you think of when you hear the word statistics?
ScanSolve AI Answer
Step-by-step solution
5 stepsPart 1
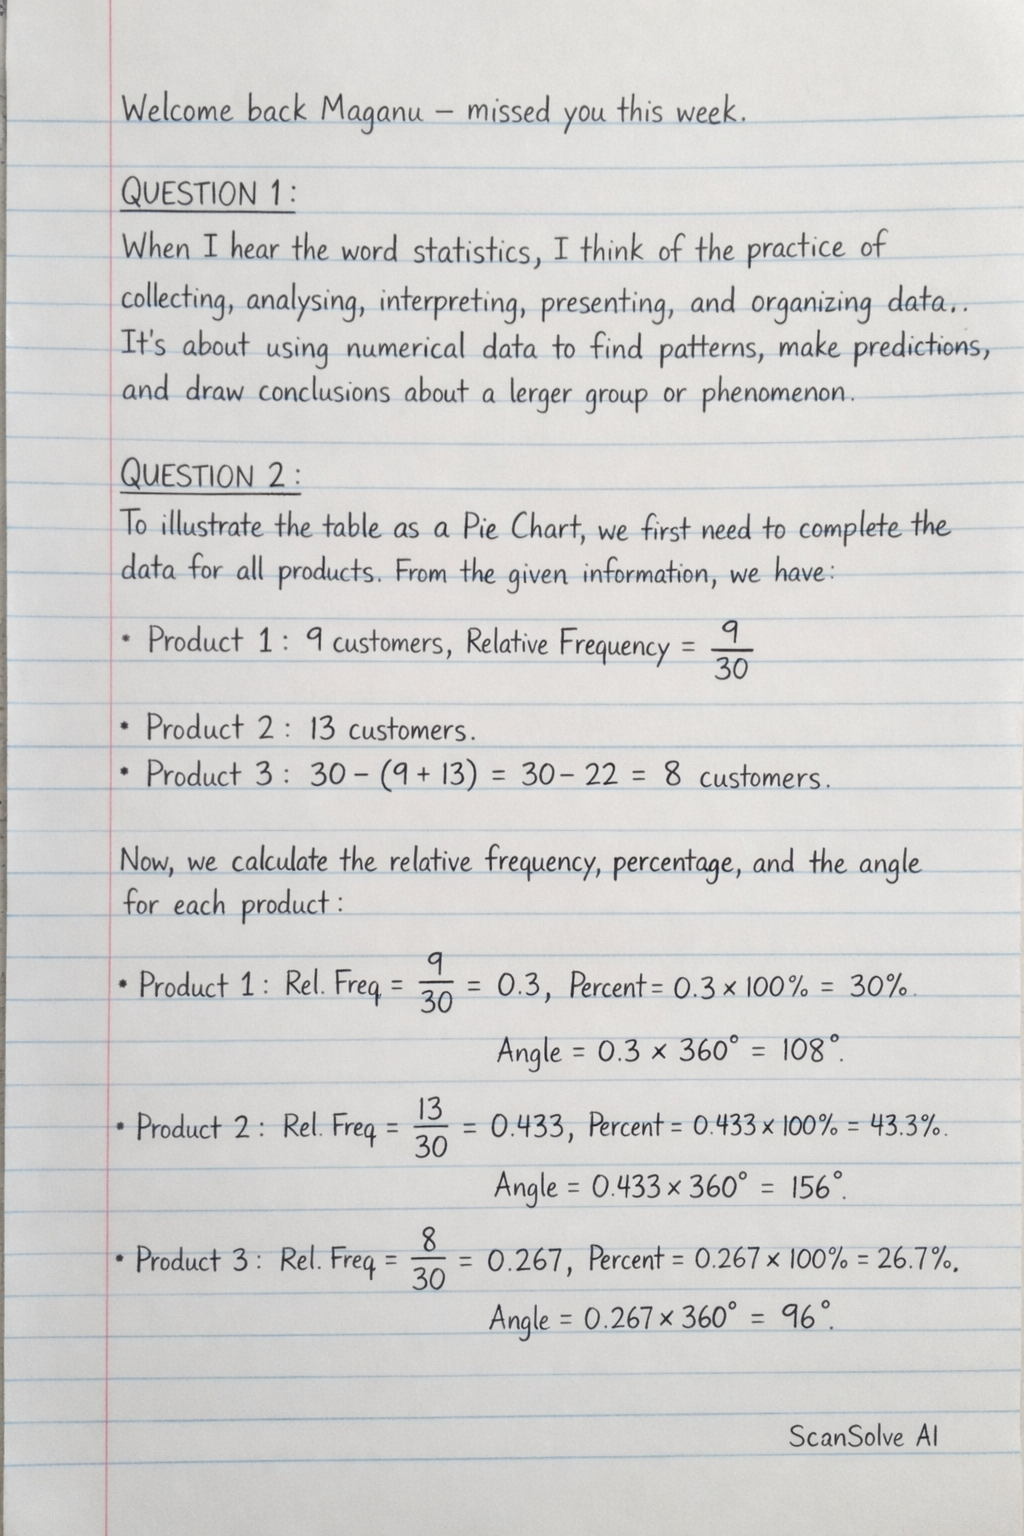
When I hear the word statistics, I think of the practice of collecting, analyzing, interpreting, presenting, and organizing data. It's about using numerical data to find patterns, make predictions, and draw conclusions about a larger group or phenomenon.
Part 2· 5 steps
To illustrate the table as a Pie Chart, we first need to complete the data for all products. From the given information, we have:
- Product 1: 9 customers, Relative Frequency = . This means the total number of customers is 30.
- Product 2: 13 customers.
- The remaining customers for Product 3 = Total customers - (Product 1 customers + Product 2 customers) = customers.
Now, we calculate the relative frequency, percentage, and the angle for each product in the pie chart.
Calculate the relative frequency, percentage, and angle for Product 1.
Number of Customers = 9
Relative Frequency =
Percentage =
Angle for Pie Chart =Calculate the relative frequency, percentage, and angle for Product 2.
Number of Customers = 13
Relative Frequency =
Percentage =
Angle for Pie Chart =Calculate the relative frequency, percentage, and angle for Product 3.
Number of Customers = 8
Relative Frequency =
Percentage =
Angle for Pie Chart =Summarize the data for the pie chart.
- Product 1 (9 customers): of the pie, corresponding to an angle of .
- Product 2 (13 customers): of the pie, corresponding to an angle of .
- Product 3 (8 customers): of the pie, corresponding to an angle of .
Instructions for drawing the Pie Chart.
- Draw a circle using a compass.
- Mark the center of the circle.
- Draw a radius from the center to the circumference. This will be your starting line.
- Using a protractor, measure and draw the first angle ( for Product 1) from the starting line. Draw another radius to mark the end of this sector.
- From the new radius, measure and draw the second angle ( for Product 2). Draw a third radius.
- The remaining sector will automatically represent the third angle ( for Product 3).
- Label each sector with the product name and its corresponding percentage. You can also use different colors for each sector.
Here is the completed table with the calculated values:
\begin{array}{|l|c|c|c|}
\hline
\textbf{Product} & \textbf{Number of Customers} & \textbf{Relative Frequency} & \textbf{Percentage} & \textbf{Angle for Pie Chart} \\
\hline
\text{Product 1} & 9 & \frac{9}{30} & 30\% & 108^\circ \\
\text{Product 2} & 13 & \frac{13}{30} & 43.33\% & 156^\circ \\
\text{Product 3} & 8 & \frac{8}{30} & 26.67\% & 96^\circ \\
\hline
\textbf{Total} & \textbf{30} & \textbf{1} & \textbf{100\%} & \textbf{360^\circ} \\
\hline
\end{array}
The pie chart would be drawn using these angles.
Still stuck on this one?
Ask a follow-up, and the answer starts from this question.
More Mathematics Questions
Handwritten Step-by-Step Solution
Get this as a handwritten image on WhatsApp — like a tutor wrote it for you.
Try on WhatsApp