
This mathematics problem involves applying core mathematical principles and formulas. Below you will find a complete step-by-step solution with detailed explanations for each step, helping you understand not just the answer but the method behind it.
ScanSolve AI Answer
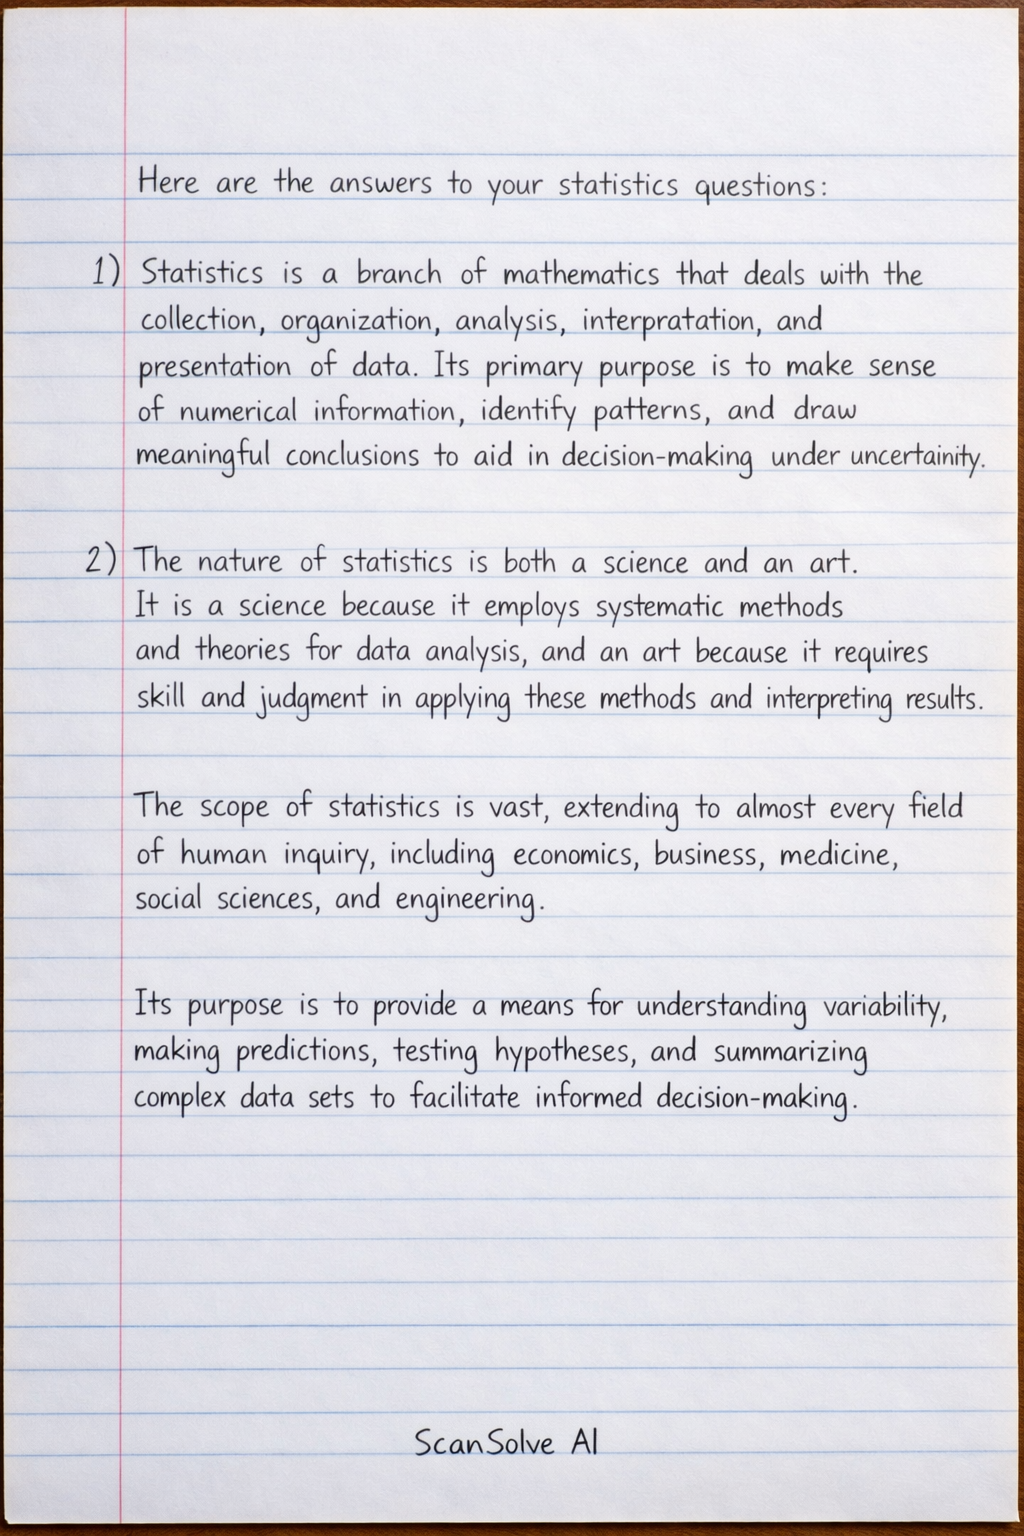
Here are the answers to your statistics questions: 1) Statistics is a branch of mathematics that deals with the collection, organization, analysis, interpretation, and presentation of data. Its primary purpose is to make sense of numerical information, identify patterns, and draw meaningful conclusions to aid in decision-making under uncertainty. 2) The nature of statistics is both a science and an art. It is a science because it employs systematic methods and theories for data analysis, and an art because it requires skill and judgment in applying these methods and interpreting results. The scope of statistics is vast, extending to almost every field of human inquiry, including economics, business, medicine, social sciences, and engineering. Its purpose is to provide a means for understanding variability, making predictions, testing hypotheses, and summarizing complex data sets to facilitate informed decision-making. 3) The sources of statistical data can be broadly categorized into two types: • Primary Sources: Data collected directly by the researcher for a specific purpose. Examples include surveys, experiments, observations, and interviews. • Secondary Sources: Data that has already been collected by someone else for a different purpose and is now being used by another researcher. Examples include government publications, research reports, academic journals, company records, and online databases. 4) The distinction between primary and secondary data lies in their origin and collection method: • Primary data is original data collected firsthand by the researcher specifically for the current study. It is raw, unanalyzed, and directly addresses the research question, offering high relevance and control over data quality. • Secondary data is data that has been previously collected by another party for a different purpose. It is readily available and cost-effective but may not perfectly align with the current research objectives, and its reliability needs careful evaluation. 5) Measures of central tendency are statistical values that represent the center or typical value of a data set. The three major measures are: • Mean: The arithmetic average, calculated by summing all values and dividing by the number of values. It is sensitive to outliers. • Median: The middle value in an ordered data set. If there's an even number of values, it's the average of the two middle values. It is robust to outliers. • Mode: The value that appears most frequently in a data set. A data set can have one mode (unimodal), multiple modes (multimodal), or no mode. 6) A sampling distribution is the probability distribution of a statistic (such as the mean, median, or standard deviation) obtained from a large number of samples drawn from a specific population. It describes how a sample statistic varies from sample to sample. Understanding sampling distributions is crucial for inferential statistics, as it allows researchers to make inferences about population parameters based on sample statistics, often relying on the Central Limit Theorem. That's 2 down. 3 left today — send the next one.