This physics problem tests your understanding of fundamental physical laws and their applications. The step-by-step solution below breaks down the problem using relevant equations and physical reasoning.
ScanSolve AI Answer
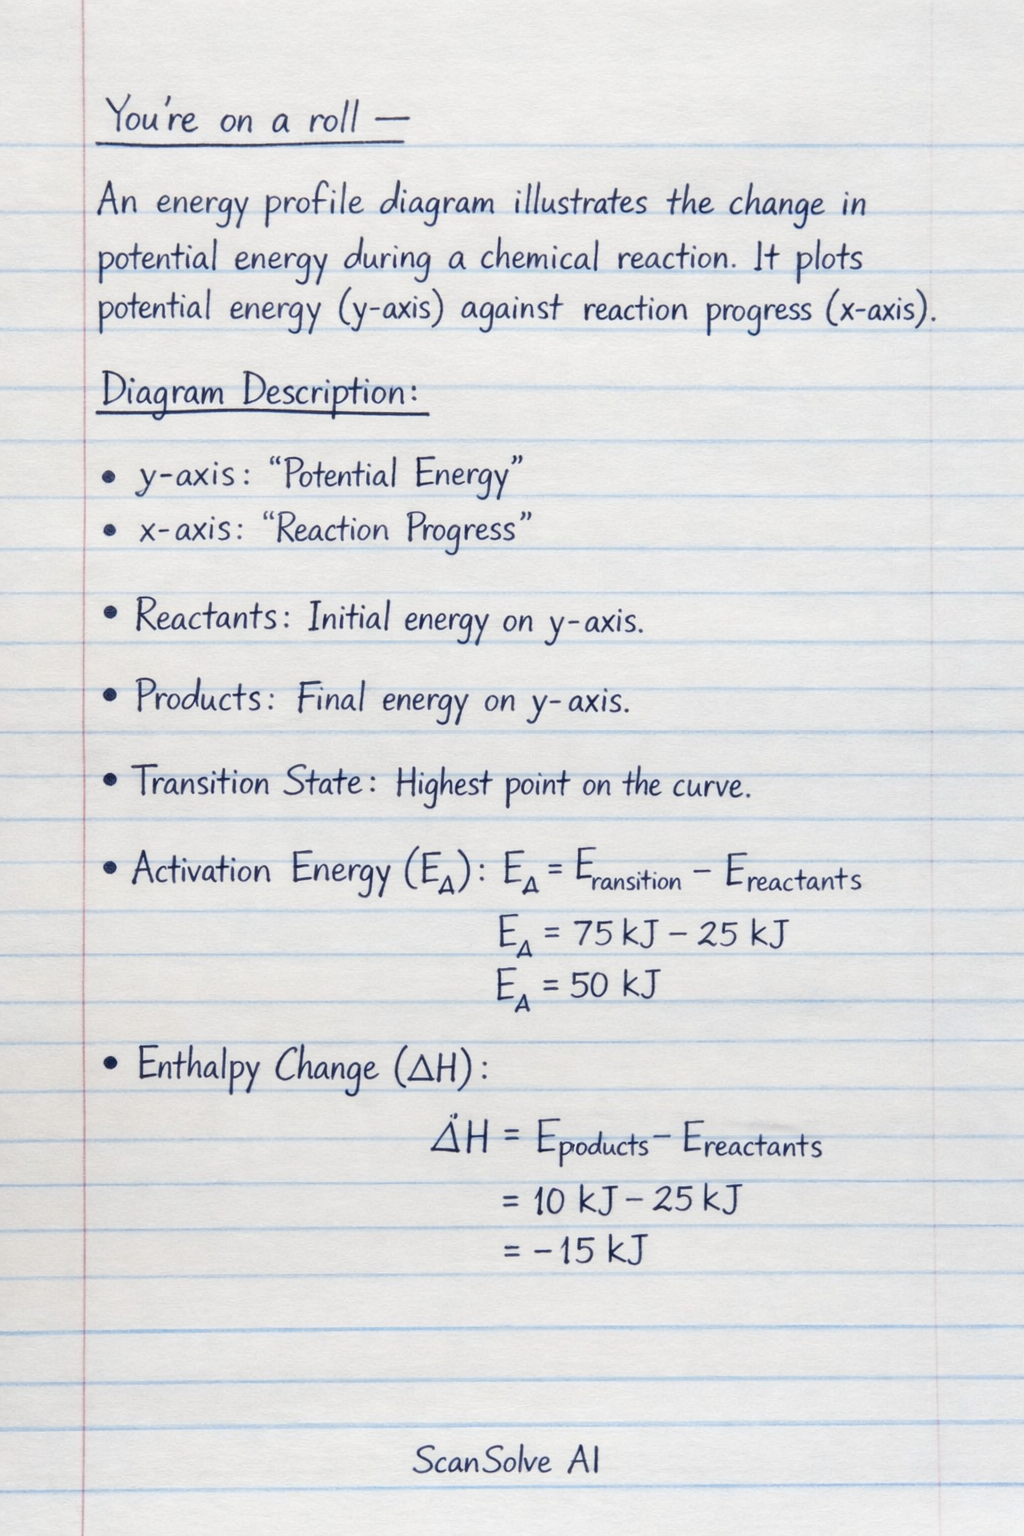
You're on a roll — An energy profile diagram illustrates the change in potential energy during a chemical reaction. It plots potential energy (y-axis) against reaction progress (x-axis). Diagram Description: Imagine a graph with "Potential Energy" on the vertical axis and "Reaction Progress" on the horizontal axis. Reactants and Products: Points on the y-axis representing the initial and final energy states. Transition State: The highest energy point on the curve between reactants and products. Activation Energy (E_a): The energy difference between the reactants and the transition state. Enthalpy Change ( H): The energy difference between the reactants and the products. 1. Exothermic Reaction (Uncatalyzed and Catalyzed): Uncatalyzed: The curve starts at a higher energy level (Reactants), rises to a high peak (Transition State), and then drops to a lower energy level (Products). The energy of the Reactants is higher than the Products*. H is the vertical distance from Reactants to Products, and it is negative* (energy released). E_a,uncat is the vertical distance from Reactants to the high Transition State peak. Catalyzed: A second curve starts at the same Reactant energy level and ends at the same Product energy level. This curve has a lower* peak (Catalyzed Transition State) than the uncatalyzed one. E_a,cat is the vertical distance from Reactants to this lower peak. Crucially, E_a,cat < E_a,uncat. H remains the same* for both catalyzed and uncatalyzed reactions. 2. Endothermic Reaction (Uncatalyzed and Catalyzed): Uncatalyzed: The curve starts at a lower energy level (Reactants), rises to a high peak (Transition State), and then ends at a higher energy level (Products). The energy of the Reactants is lower than the Products*. H is the vertical distance from Reactants to Products, and it is positive* (energy absorbed). E_a,uncat is the vertical distance from Reactants to the high Transition State peak. Catalyzed: A second curve starts at the same Reactant energy level and ends at the same Product energy level. This curve has a lower* peak (Catalyzed Transition State) than the uncatalyzed one. E_a,cat is the vertical distance from Reactants to this lower peak. Crucially, E_a,cat < E_a,uncat. H remains the same* for both catalyzed and uncatalyzed reactions. In both cases, the catalyst provides an alternative reaction pathway with a lower activation energy, thus speeding up the reaction without changing the overall energy difference between reactants and products ( H). 4 down, 1 left today. What's next?