
We read your photo as:
Describe the inheritance pattern and identify key elements of the investigation in questions 3.5.1, 3.5.2, and 3.5.3.
ScanSolve AI Answer
Step-by-step solution
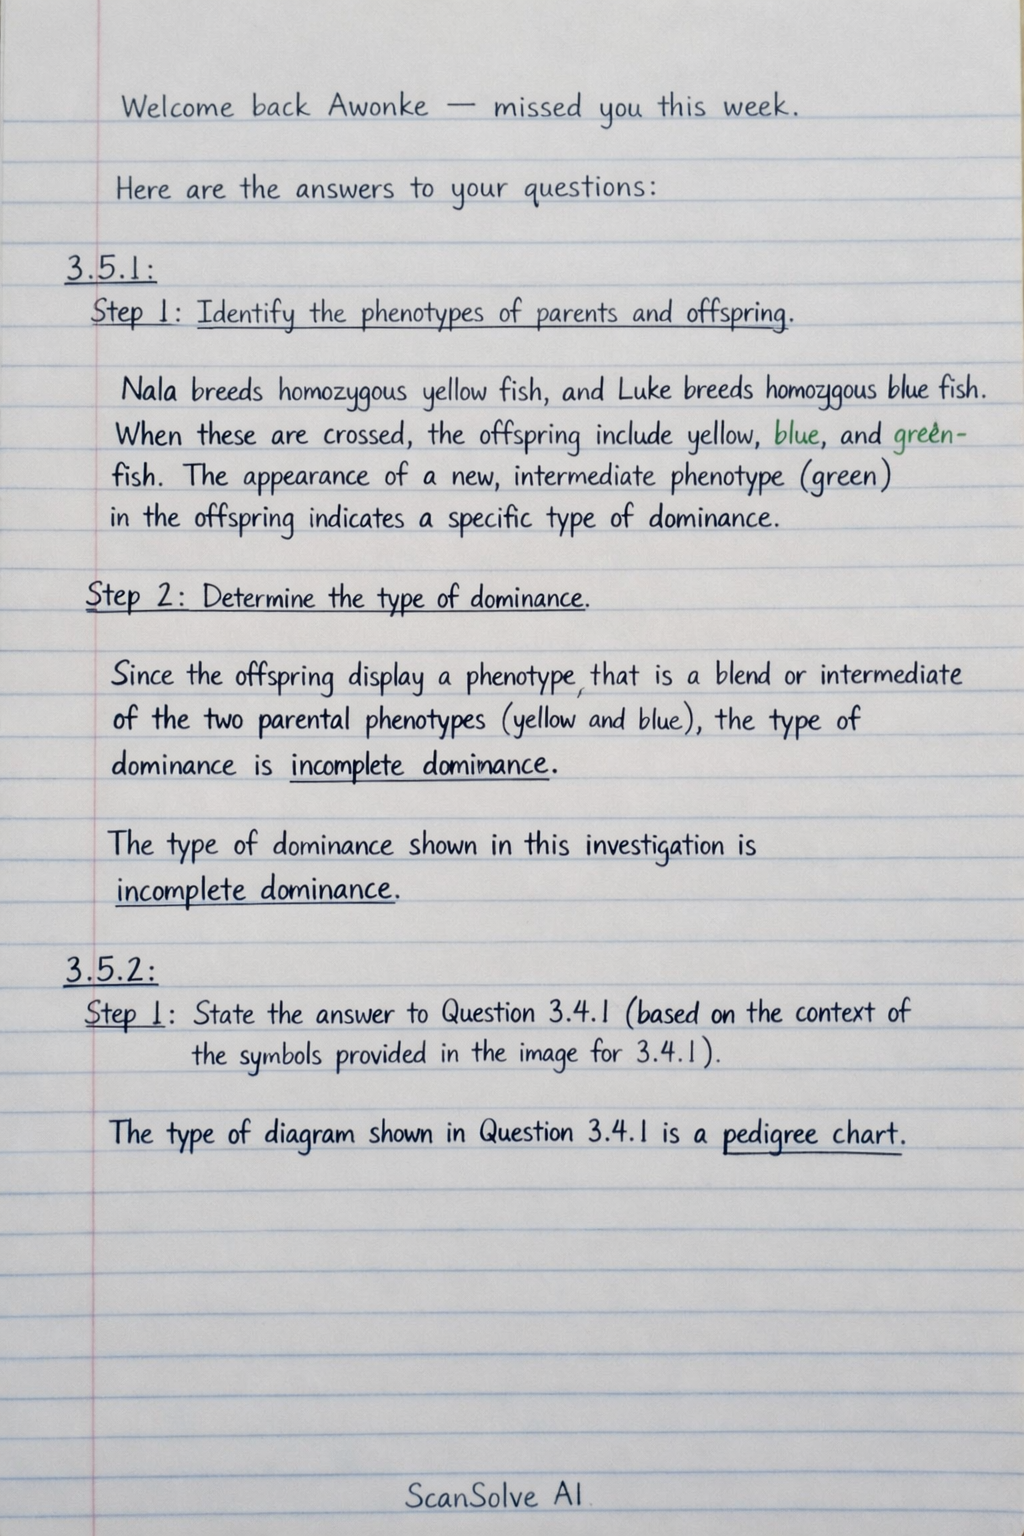
4 stepsHere are the answers to your questions:
3.5.1:
Identify the phenotypes of parents and offspring.
Nala breeds homozygous yellow fish, and Luke breeds homozygous blue fish. When these are crossed, the offspring include yellow, blue, and green fish. The appearance of a new, intermediate phenotype (green) in the offspring indicates a specific type of dominance.
Determine the type of dominance.
Since the offspring display a phenotype that is a blend or intermediate of the two parental phenotypes (yellow and blue), the type of dominance is incomplete dominance.
The type of dominance shown in this investigation is incomplete dominance.3.5.2:
State the answer to Question 3.4.1 (based on the context of the symbols provided in the image for 3.4.1).
The type of diagram shown in Question 3.4.1 is a pedigree chart.
Provide the reason for the answer.
A pedigree chart uses standardized symbols (such as circles for females and shaded symbols for affected individuals) to illustrate the inheritance pattern of a trait or disorder across multiple generations within a family.
3.5.3:
a) TWO ways in which the reliability of this investigation was ensured:
- The investigation was conducted over five years, allowing for repeated trials.
- A large sample size of 100 offspring was collected each year, and the results were averaged.
b) ONE way in which the results of the investigation were made more valid:
- Using homozygous (purebred) yellow and blue fish for the initial cross ensured that the genetic basis of the parental phenotypes was known and controlled.
3.5.4:
TWO planning steps that would have been taken for this investigation:- Formulating a clear hypothesis regarding the inheritance pattern of fish color (e.g., predicting incomplete dominance).
- Identifying and selecting the specific homozygous yellow and homozygous blue fish strains to be used for breeding.
3.5.5:
To represent the results of this investigation, a bar graph should be drawn with the following components:- Title: Average Number of Offspring Phenotypes
- X-axis label: Phenotype
- Y-axis label: Average number of fish over five years
- Bars: Three distinct bars of equal width, representing the Yellow, Green, and Blue phenotypes.
- Values: The bar for Yellow should reach a height corresponding to 20, Green to 65, and Blue to 15.
- Scale: The Y-axis should have an appropriate numerical scale, starting from 0 and extending to at least 70 to accommodate the highest value (65).
Still stuck on this one?
Ask a follow-up, and the answer starts from this question.
More Biology Questions
Handwritten Step-by-Step Solution
Get this as a handwritten image on WhatsApp — like a tutor wrote it for you.
Try on WhatsApp