
We read your photo as:
Based on the graph above, indicate the average price gained by farmers in the cooperative. Justify why farmer B may be tempted to leave the cooperative. Calculate the price gap between Farmer B and Farmer C based on the graph above.
Business/Management
ScanSolve AI Answer
Step-by-step solution
2 stepsHere are the answers based on the graph:
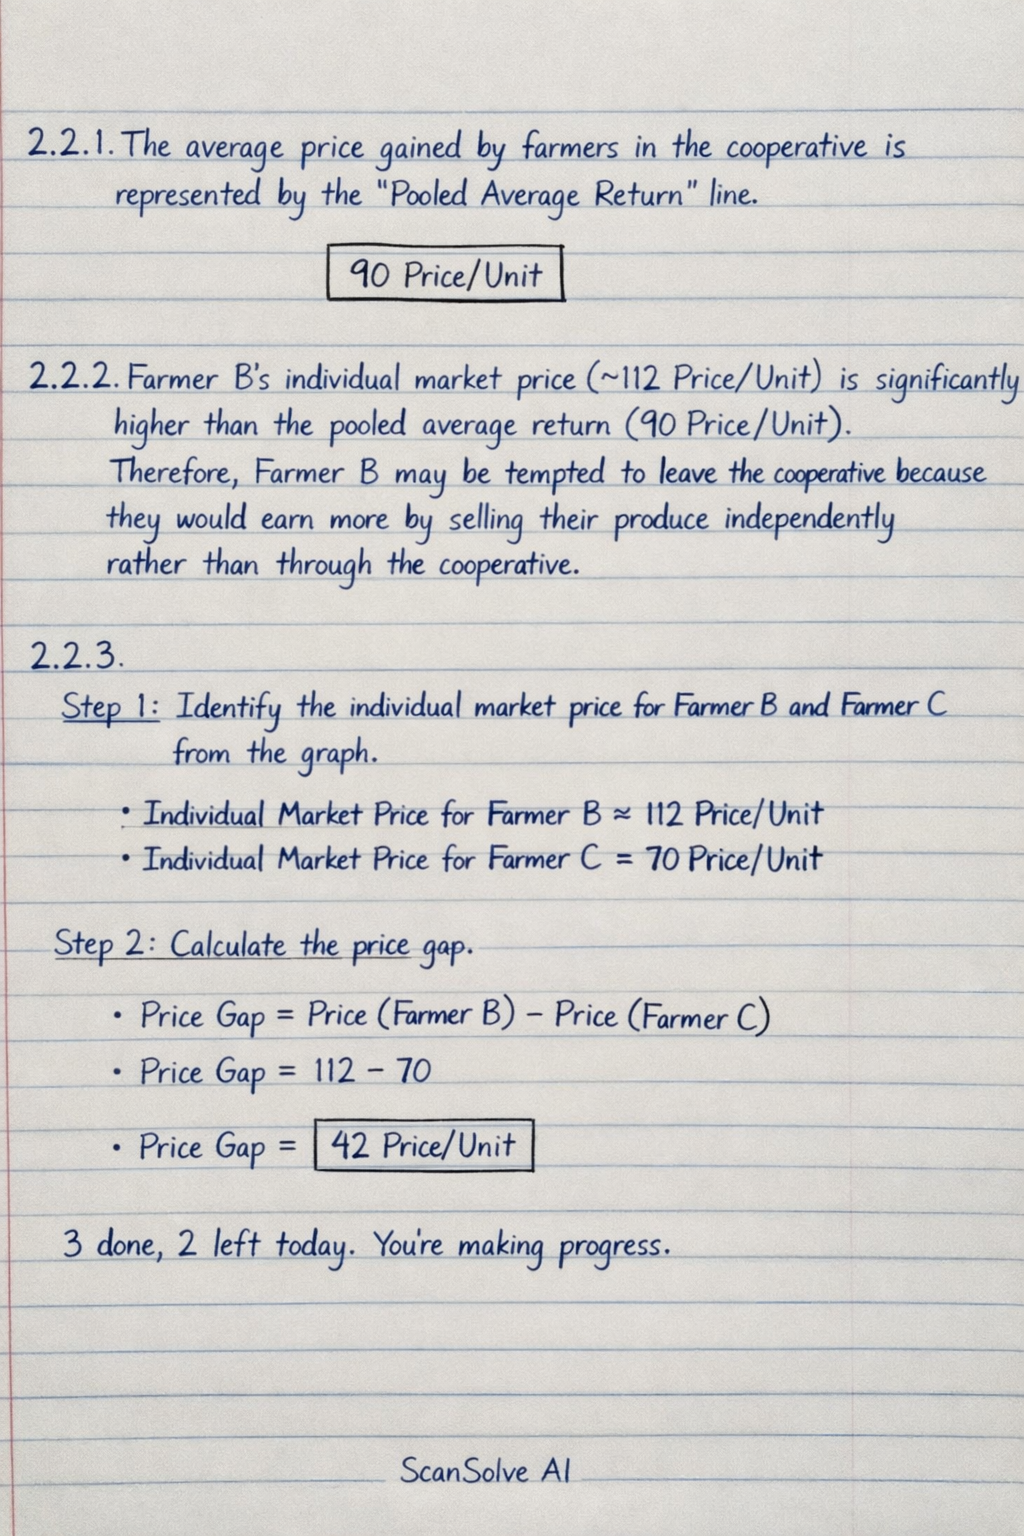
2.2.1 The average price gained by farmers in the cooperative is represented by the "Pooled Average Return" line.
2.2.2 Farmer B's individual market price (approximately 112 Price/Unit) is significantly higher than the pooled average return (90 Price/Unit). Therefore, Farmer B may be tempted to leave the cooperative because they would earn more by selling their produce independently rather than through the cooperative.
2.2.3
Identify the individual market price for Farmer B and Farmer C from the graph.
- Individual Market Price for Farmer B Price/Unit
- Individual Market Price for Farmer C Price/Unit
Calculate the price gap.
Was this helpful?
Still stuck on this one?
Ask a follow-up, and the answer starts from this question.
Got a different question?Ask your own question
More Business/Management Questions
QIdentify curves A and B in the graph above. Give the economic term for point C. Identify the…QThe graph shows profits (in hundreds of thousands of Rands) each year for two companies, A and B.QAnalyze the provided graph showing egg collection on Juma's farm and answer the following questions.QStudy the graph and answer the questions that follow. Indicate the profit maximization point and…QCalculate the standard deviation for the given grouped data on the amount of money farmers have.
Handwritten Step-by-Step Solution
Get this as a handwritten image on WhatsApp — like a tutor wrote it for you.
Try on WhatsApp