
We read your photo as:
The graph shows profits (in hundreds of thousands of Rands) each year for two companies, A and B.
Mathematics
ScanSolve AI Answer
Answer
Step-by-step solution
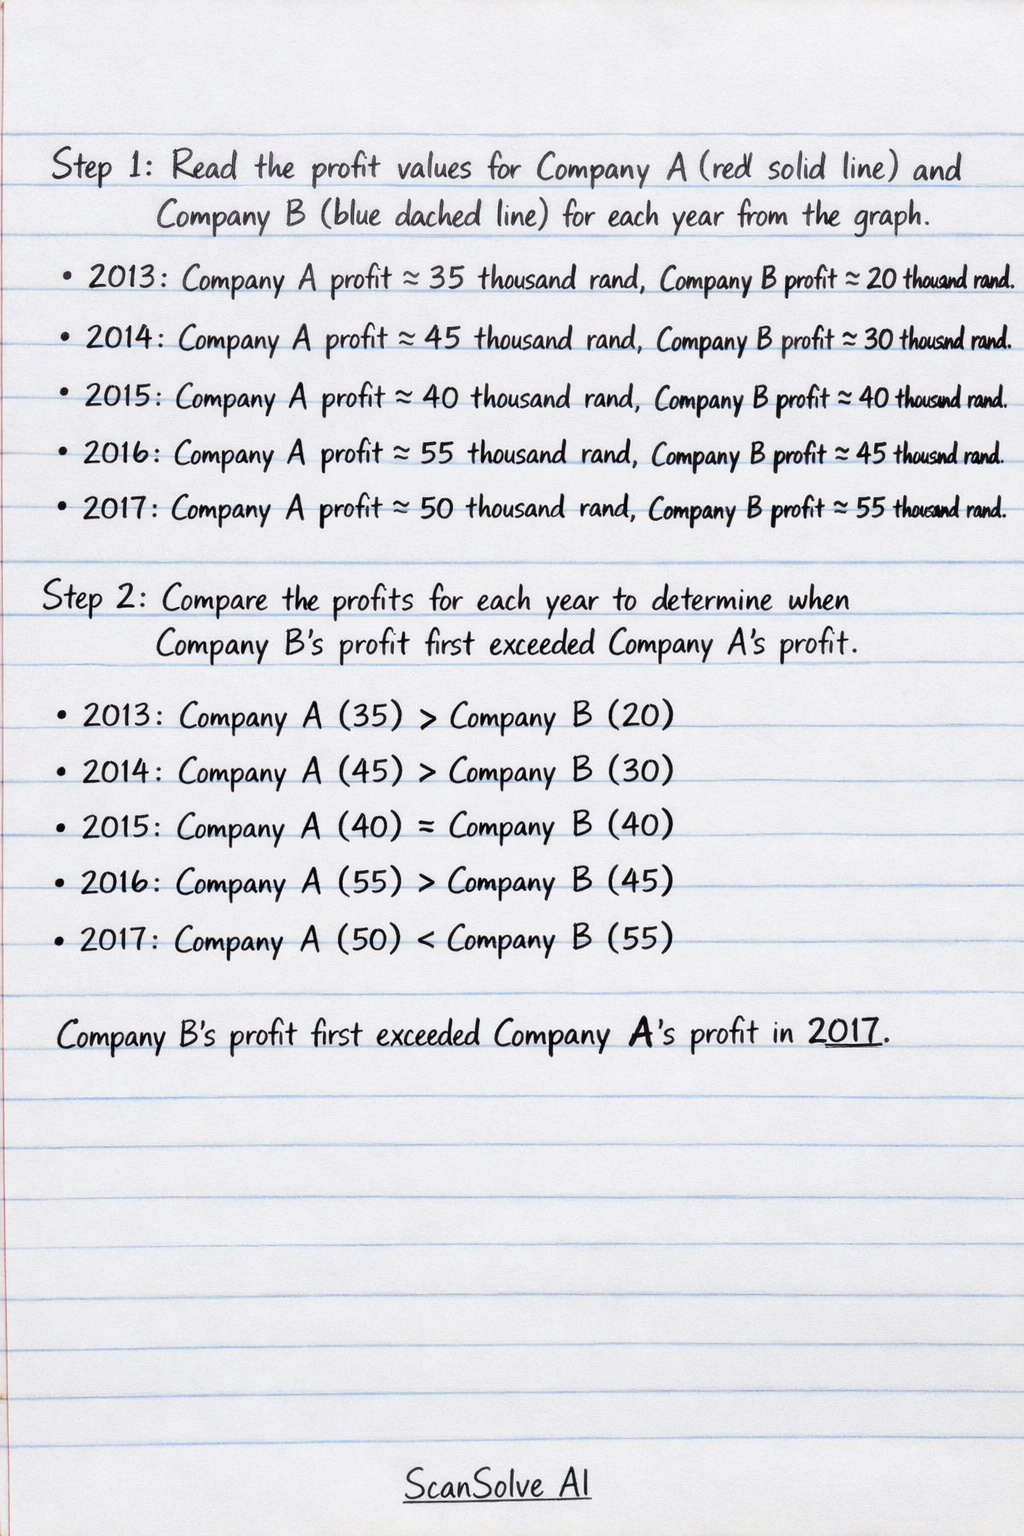
2 stepsRead the profit values for Company A (red solid line) and Company B (blue dashed line) for each year from the graph.
- 2013: Company A profit thousand rand, Company B profit thousand rand.
- 2014: Company A profit thousand rand, Company B profit thousand rand.
- 2015: Company A profit thousand rand, Company B profit thousand rand.
- 2016: Company A profit thousand rand, Company B profit thousand rand.
- 2017: Company A profit thousand rand, Company B profit thousand rand.
Compare the profits for each year to determine when Company B's profit first exceeded Company A's profit.
- 2013: Company A (35) > Company B (20)
- 2014: Company A (45) > Company B (30)
- 2015: Company A (40) = Company B (40)
- 2016: Company A (55) > Company B (45)
- 2017: Company A (50) < Company B (55)
Company B's profit first exceeded Company A's profit in 2017.
The year in which Company B's profit first exceeded Company A's profit is .
Was this helpful?
Try one yourself
A new problem that tests the same skill.
Still stuck on this one?
Ask a follow-up, and the answer starts from this question.
Got a different question?Ask your own question
More Mathematics Questions
QCalculate the net profits of A and B. Which of A and B is more profitable?QA started a business with ₹ 12,000. After 3 months of starting the business, B joined him with ₹…QCalculate the yearly income of three workers (Aku, Brako, Dagadu), find the difference between Aku…QA vendor spends up to K18 000 to buy soya pieces of type A and B. He buys at most 30 packets total…QConstruct matrix A for 2019 sales.
Handwritten Step-by-Step Solution
Get this as a handwritten image on WhatsApp — like a tutor wrote it for you.
Try on WhatsApp