
This business/management problem is solved step by step below, with detailed explanations to help you understand the method and arrive at the correct answer.
ScanSolve AI Answer
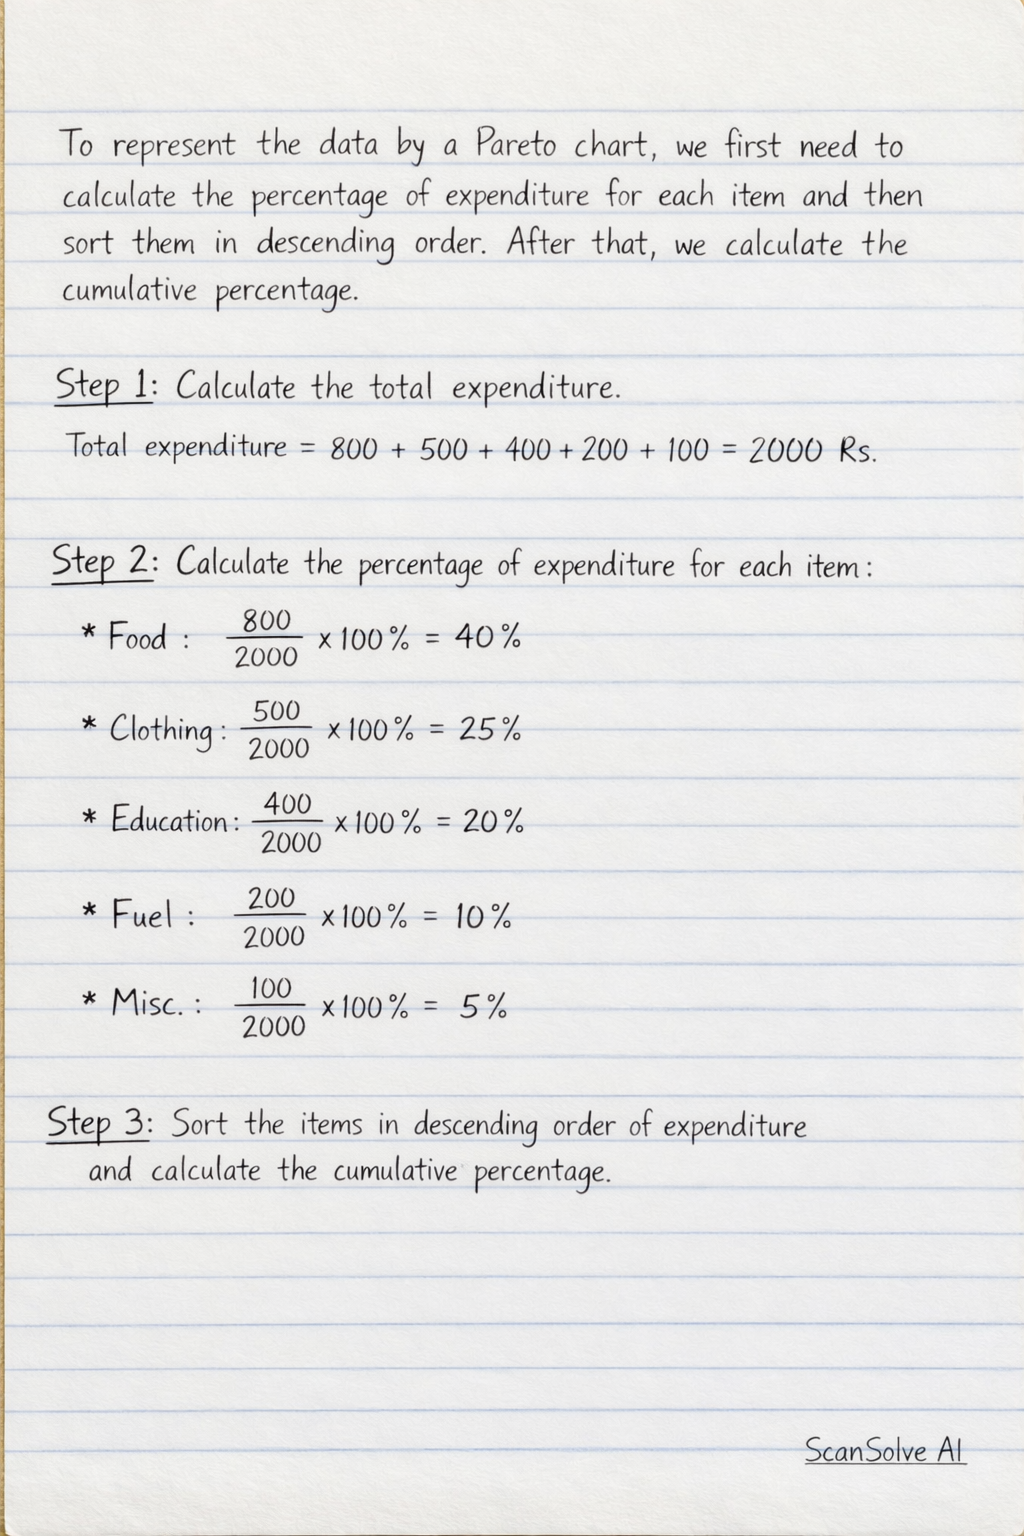
To represent the data by a Pareto chart, we first need to calculate the percentage of expenditure for each item and then sort them in descending order. After that, we calculate the cumulative percentage. Step 1: Calculate the total expenditure. Total expenditure = 800 + 500 + 400 + 200 + 100 = 2000 Rs. Step 2: Calculate the percentage of expenditure for each item. Food: (800)/(2000) × 100\% = 40\% Clothing: (500)/(2000) × 100\% = 25\% Education: (400)/(2000) × 100\% = 20\% Fuel: (200)/(2000) × 100\% = 10\% Misc.: (100)/(2000) × 100\% = 5\% Step 3: Sort the items in descending order of expenditure and calculate the cumulative percentage. |l|c|c|c| Item & Expenditure (Rs) & Percentage (\%) & Cumulative Percentage (\%) \\ Food & 800 & 40 & 40 \\ Clothing & 500 & 25 & 40 + 25 = 65 \\ Education & 400 & 20 & 65 + 20 = 85 \\ Fuel & 200 & 10 & 85 + 10 = 95 \\ Misc. & 100 & 5 & 95 + 5 = 100 \\ Step 4: Construct the Pareto chart. A Pareto chart is a bar chart where the bars are arranged in descending order of frequency or cost, combined with a line graph that shows the cumulative percentage. The x-axis* would list the items in the order: Food, Clothing, Education, Fuel, Misc. The left y-axis* would represent the expenditure in Rupees, ranging from 0 to 800. Bars would be drawn for each item corresponding to its expenditure. The right y-axis* would represent the cumulative percentage, ranging from 0% to 100%. A line graph would be plotted using the cumulative percentages for each item. The table above provides all the necessary data to construct the Pareto chart. Send me the next one 📸