
We read your photo as:
Please need from the above table to sketch the following, Tital Revenue Curve Marginal Rvenue Curve Marginal Cost Curve
ScanSolve AI Answer
Step-by-step solution
3 stepsYou're asking to sketch the curves based on the table we completed. Here are the points for each curve to help you sketch them on a graph:
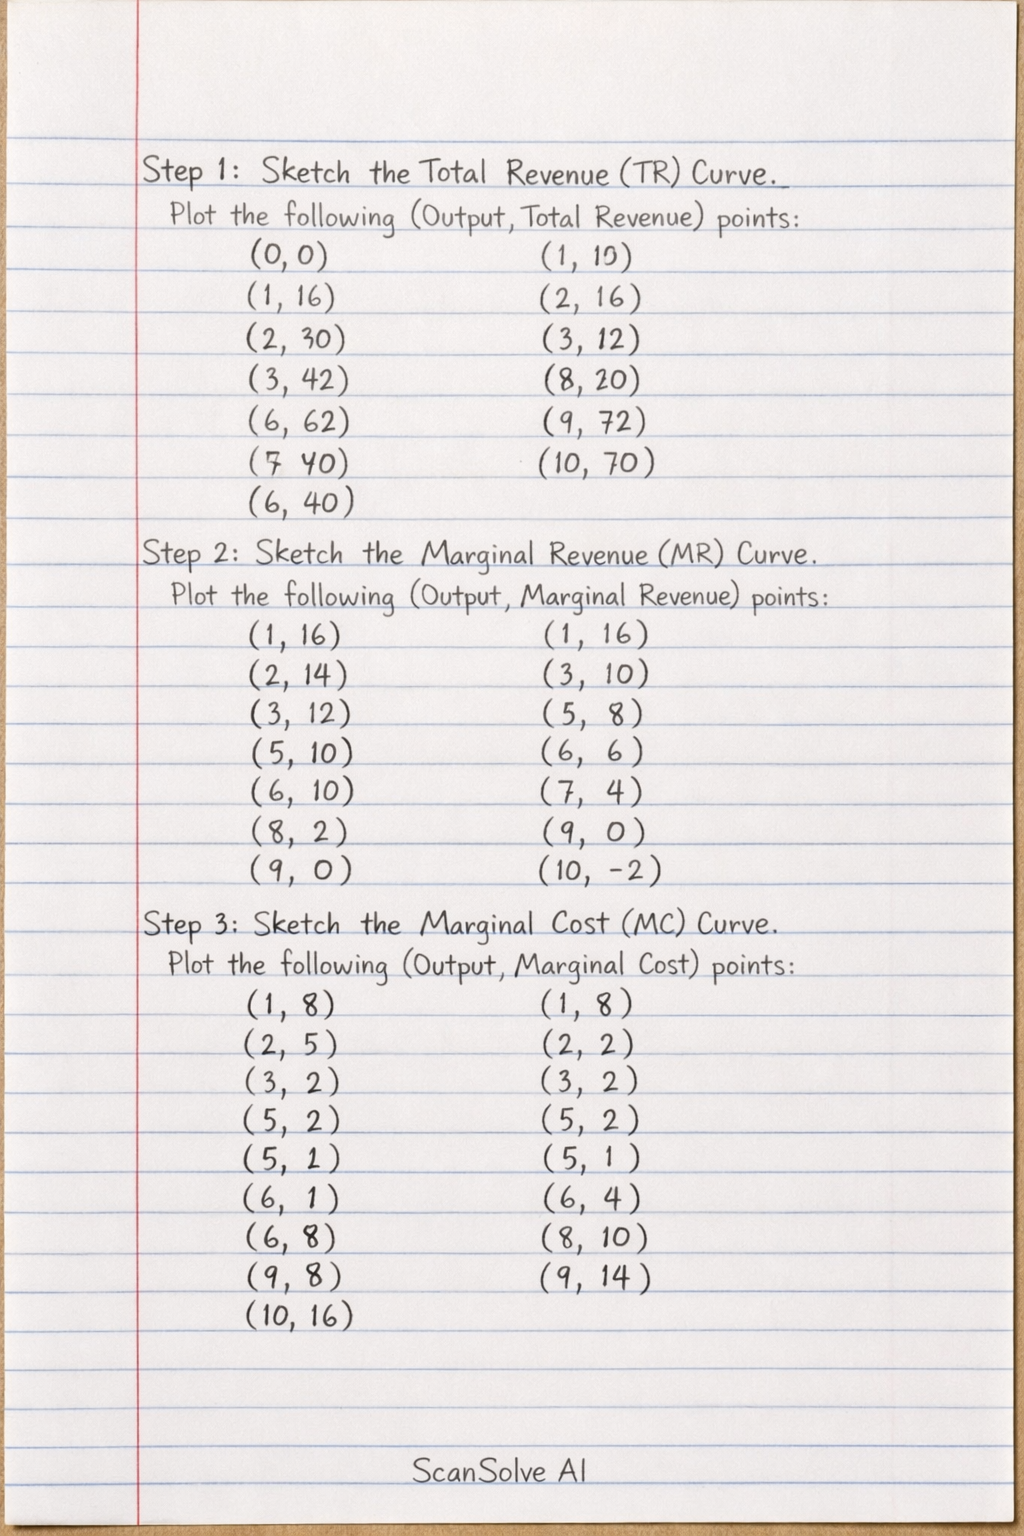
Sketch the Total Revenue (TR) Curve.
Plot the following (Output, Total Revenue) points on your graph and connect them:
- (0, 0)
- (1, 16)
- (2, 30)
- (3, 42)
- (4, 52)
- (5, 60)
- (6, 66)
- (7, 70)
- (8, 72)
- (9, 72)
- (10, 70)
Sketch the Marginal Revenue (MR) Curve.
Plot the following (Output, Marginal Revenue) points on your graph and connect them:
- (1, 16)
- (2, 14)
- (3, 12)
- (4, 10)
- (5, 8)
- (6, 6)
- (7, 4)
- (8, 2)
- (9, 0)
- (10, -2)
Sketch the Marginal Cost (MC) Curve.
Plot the following (Output, Marginal Cost) points on your graph and connect them:
- (1, 8)
- (2, 5)
- (3, 2)
- (4, 2)
- (5, 1)
- (6, 4)
- (7, 8)
- (8, 10)
- (9, 14)
- (10, 16)
When sketching, remember to label your axes (Output on the x-axis, Revenue/Cost on the y-axis) and each curve clearly. The TR curve will typically be an inverted U-shape, while the MR curve will be downward sloping. The MC curve will generally be U-shaped.
Still stuck on this one?
Ask a follow-up, and the answer starts from this question.
More Business/Management Questions
Handwritten Step-by-Step Solution
Get this as a handwritten image on WhatsApp — like a tutor wrote it for you.
Try on WhatsApp