
We read your photo as:
How can the yield of SO3(g) be increased in the reaction 2SO2(g) + O2(g) <=> 2SO3(g)? Draw the energy profile diagram for a catalyzed reaction.
ScanSolve AI Answer
Step-by-step solution
2 stepsState two ways of increasing the yield of .
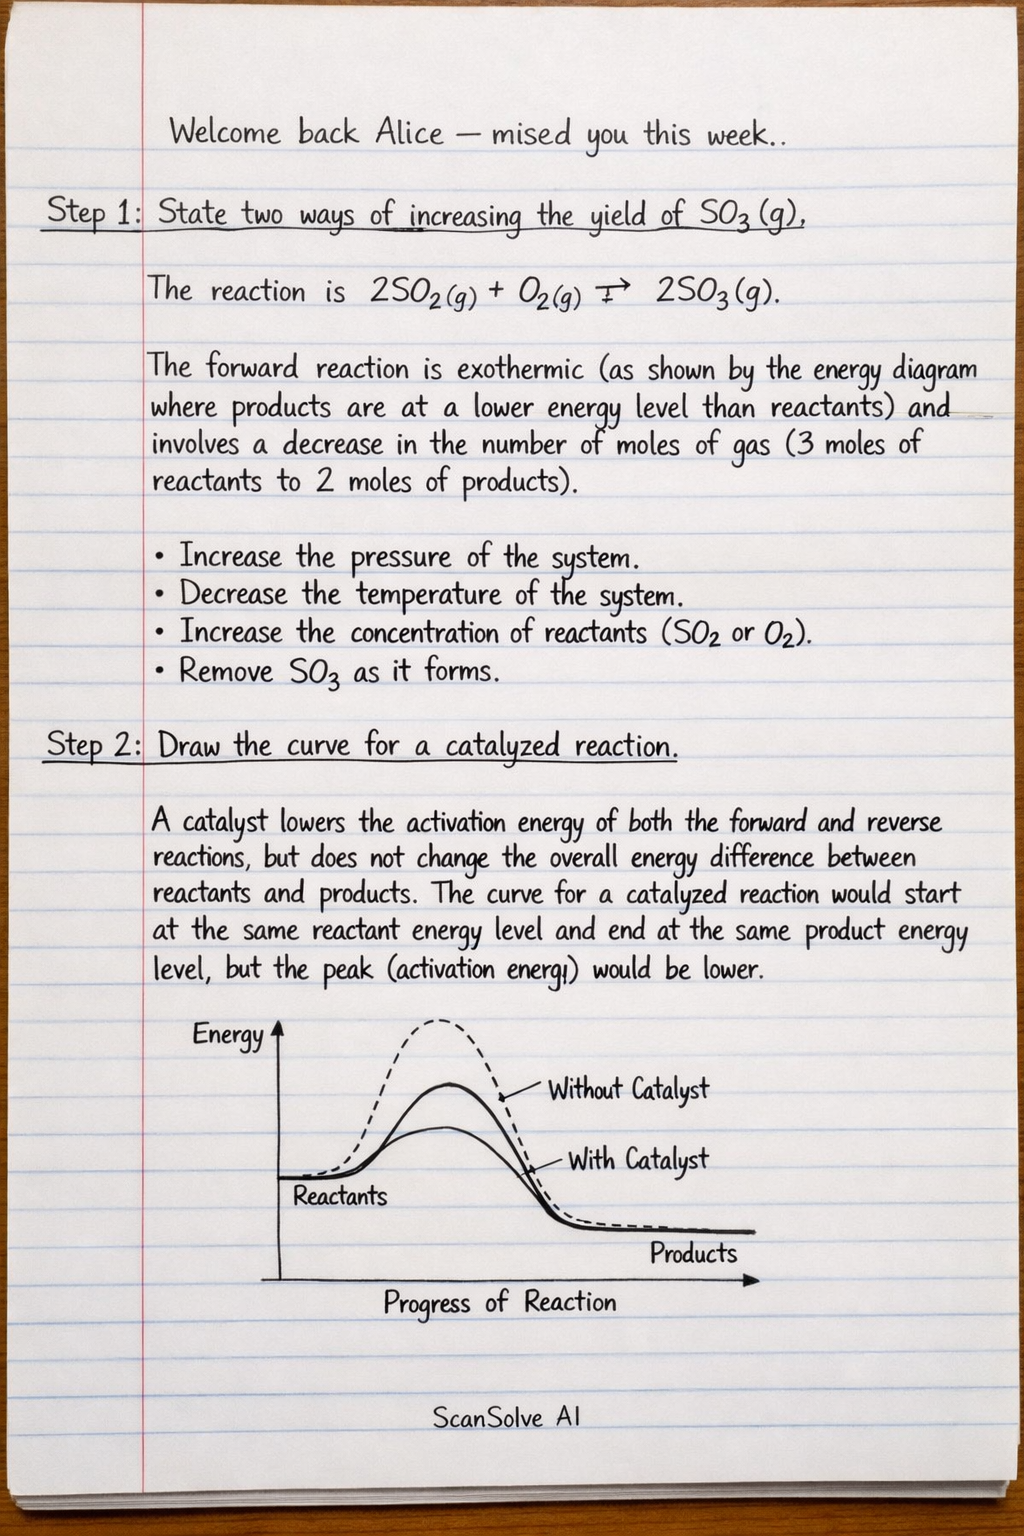
The reaction is . The forward reaction is exothermic (as shown by the energy diagram where products are at a lower energy level than reactants) and involves a decrease in the number of moles of gas (3 moles of reactants to 2 moles of products).
- Increase the pressure of the system.
- Decrease the temperature of the system.
- Increase the concentration of reactants ( or ).
- Remove as it forms.
Draw the curve for a catalyzed reaction.
A catalyst lowers the activation energy of both the forward and reverse reactions but does not change the overall energy difference between reactants and products. The curve for a catalyzed reaction would start at the same reactant energy level and end at the same product energy level, but the peak (activation energy) would be lower.
The diagram with the catalyst curve would look like this:
\text{Energy}
\begin{tikzpicture}[scale=0.8]
    % Original curve
    \draw[thick] (0,3) -- (1,3) node[above] {Reactants};
    \draw[thick] (1,3) .. controls (2.5,5) and (3.5,5) .. (5,2);
    \draw[thick] (5,2) -- (6,2) node[below] {Products};

    % Catalyst curve (lower activation energy)
    \draw[thick, red, dashed] (0,3) -- (1,3);
    \draw[thick, red, dashed] (1,3) .. controls (2.5,4) and (3.5,4) .. (5,2); % Lower peak
    \draw[thick, red, dashed] (5,2) -- (6,2);

    % Axes
    \draw[->] (0,1) -- (0,5) node[above] {Energy};
    \draw[->] (0,2.5) -- (6,2.5) node[right] {Reaction Pathway};
\end{tikzpicture}
The dashed red line represents the reaction pathway when a catalyst is used.
Still stuck on this one?
Ask a follow-up, and the answer starts from this question.
More Chemistry Questions
Handwritten Step-by-Step Solution
Get this as a handwritten image on WhatsApp — like a tutor wrote it for you.
Try on WhatsApp