
We read your photo as:
Plot a graph of temperature change against the volume of solution B added, and draw lines of best fit. The first line should pass through (0,0).
Chemistry
ScanSolve AI Answer
Here's how to approach the next parts of your question:
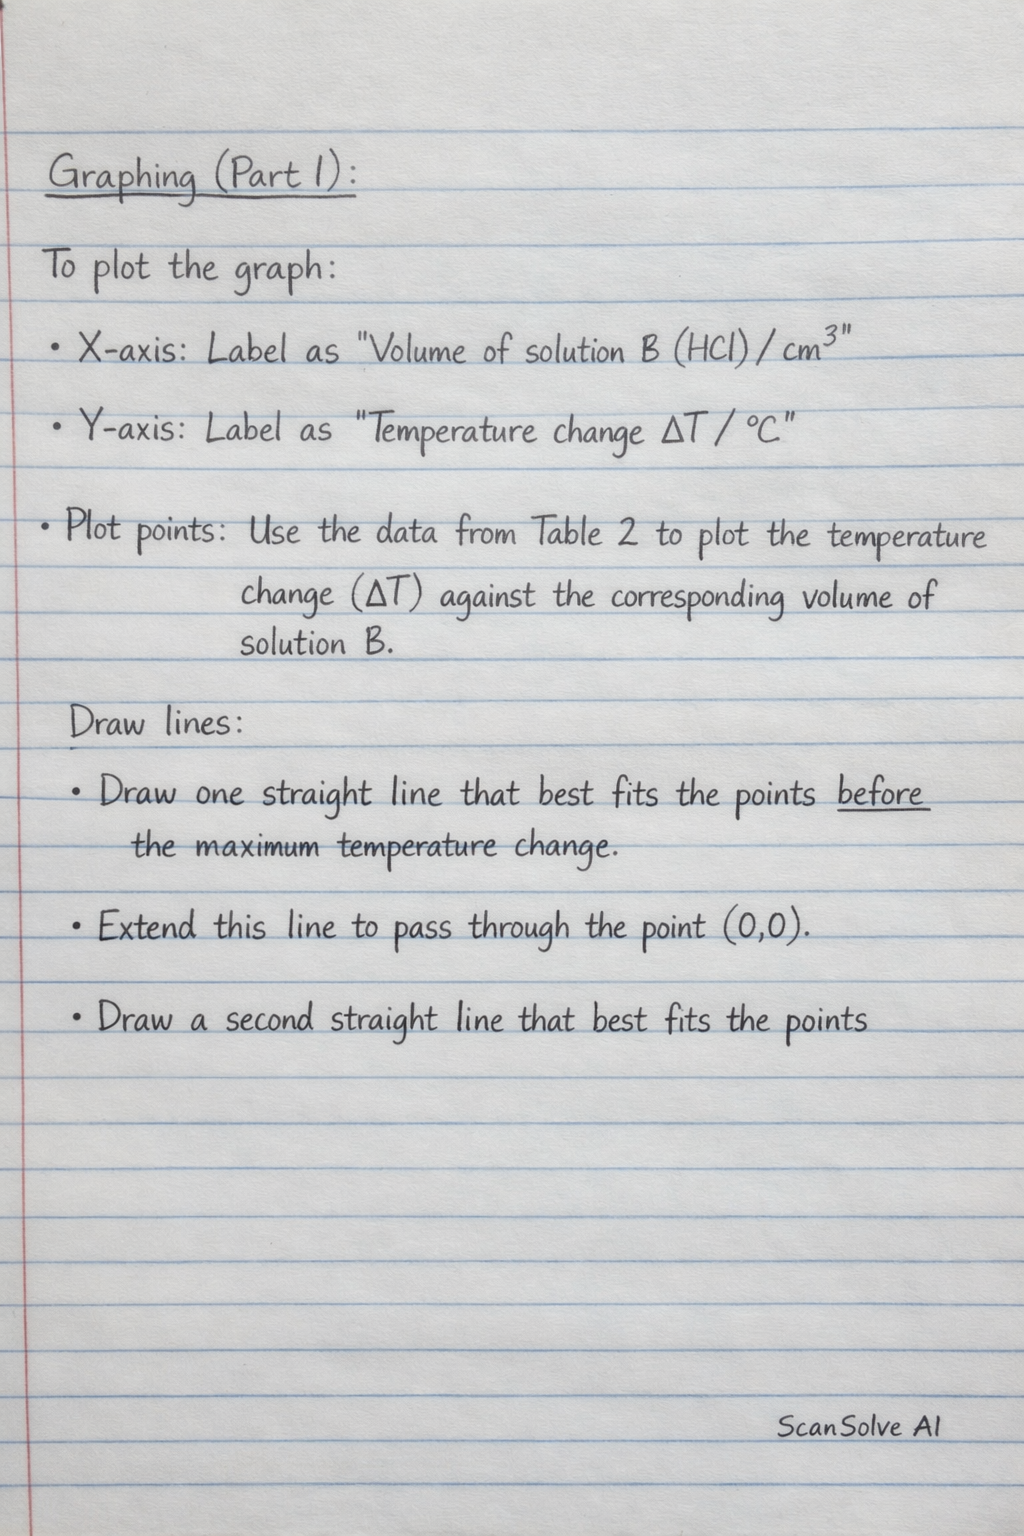
Graphing (Part 1):
To plot the graph:
- X-axis: Label the horizontal axis "Volume of solution B (HCl) / cm³".
- Y-axis: Label the vertical axis "Temperature change / °C".
- Plot points: Use the data from Table 2 to plot the temperature change () against the corresponding volume of solution B.
- Draw lines:
- Draw one straight line that best fits the points before the maximum temperature change, extending it to pass through the point (0,0).
- Draw a second straight line that best fits the points
Was this helpful?
Still stuck on this one?
Ask a follow-up, and the answer starts from this question.
Got a different question?Ask your own question
More Chemistry Questions
QPart a) On your graph, draw two best straight lines. One line is for the temperature before adding…QPlot a graph of temperature against time and determine the temperature change.QDraw a graph showing the change in temperature of water over time when heated, using the data from…QDraw a graph of the rate of reaction against temperature using the provided data.QDraw and label the axes. The x-axis should represent Temperature (^ C) and the y-axis should…
Handwritten Step-by-Step Solution
Get this as a handwritten image on WhatsApp — like a tutor wrote it for you.
Try on WhatsApp