
This computer science problem involves algorithmic thinking and programming concepts. The solution below explains the approach, logic, and implementation step by step.
ScanSolve AI Answer
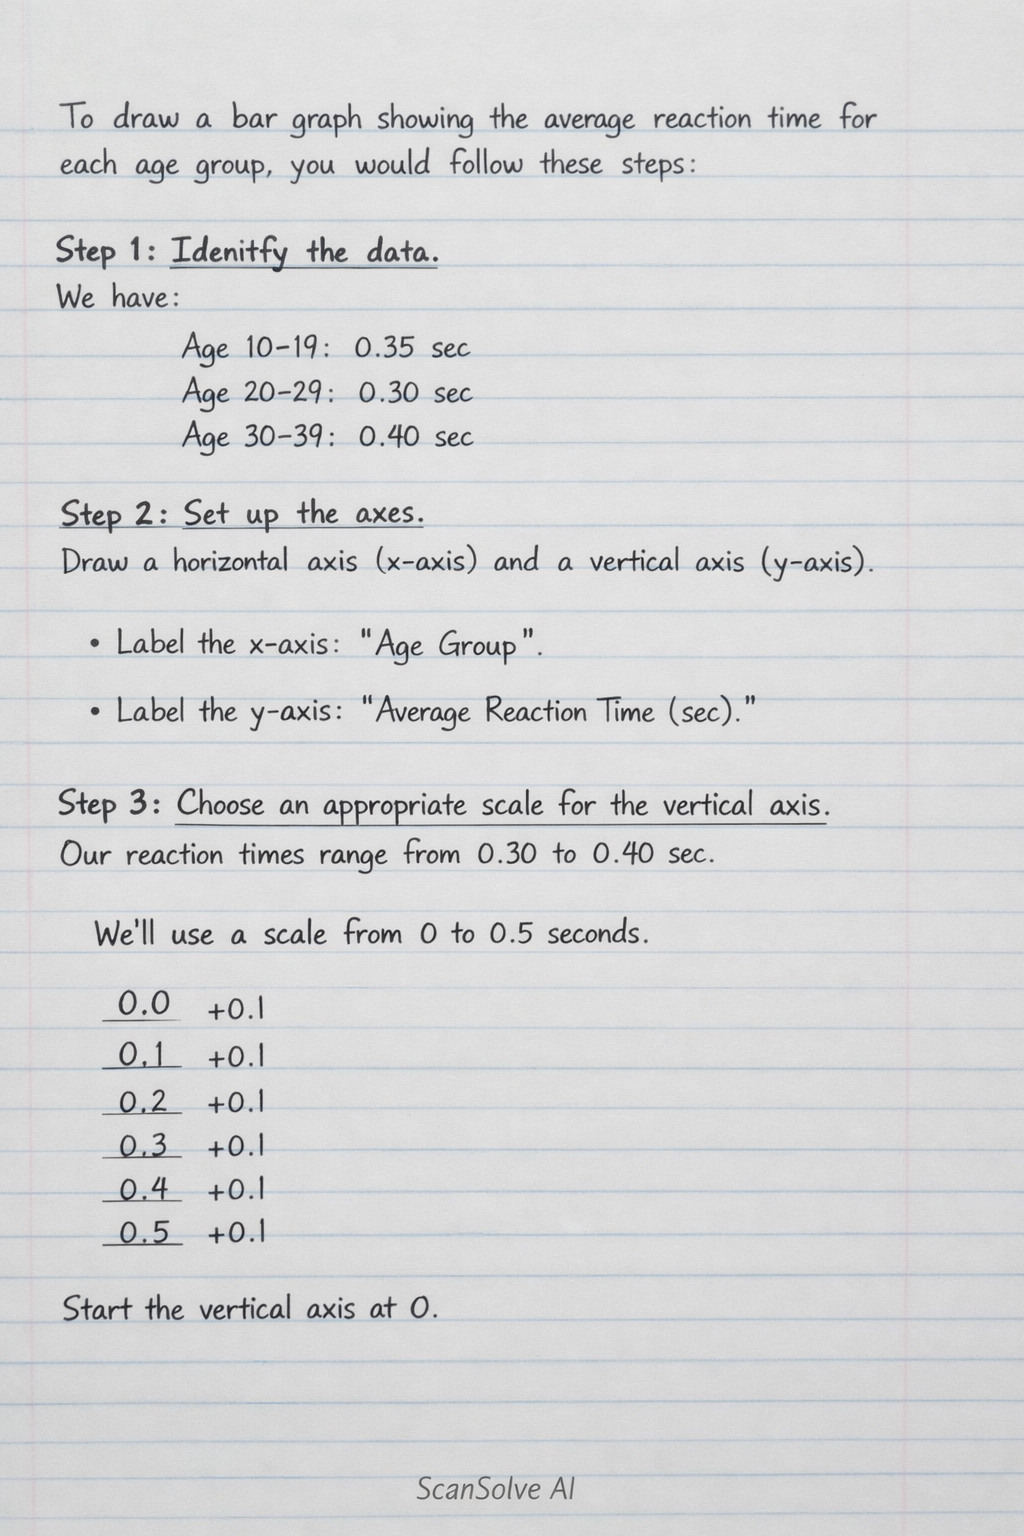
To draw a bar graph showing the average reaction time for each age group, you would follow these steps: Step 1: Identify the data. You will need the calculated average reaction times for each age group from the previous data collection and calculation steps. For example, if you have age groups 10-19, 20-29, 30-39, and their respective average reaction times. Step 2: Set up the axes. Draw a horizontal axis (x-axis) and a vertical axis (y-axis). • Label the horizontal axis "Age Group". This axis will represent the different age categories. • Label the vertical axis "Average Reaction Time (sec)". This axis will represent the numerical values of the average reaction times. Step 3: Choose an appropriate scale for the vertical axis. Look at the range of your average reaction times. Choose a scale that allows all data points to fit comfortably on the graph and makes the differences between bars clear. Start the vertical axis at 0. Step 4: Draw the bars. For each age group, draw a rectangular bar. • The width of each bar should be consistent. • The height of each bar should correspond to the average reaction time for that specific age group, as read from the vertical axis. • Leave equal spaces between the bars. Step 5: Add a title. Give your bar graph a clear and descriptive title, such as "Average Reaction Time by Age Group". Here is a conceptual representation of what the bar graph would look like, assuming you have the data: A bar graph with 'Age Group' on the x-axis and 'Average Reaction Time (sec)' on the y-axis, featuring distinct bars for each age group whose heights correspond to their calculated average reaction times. That's 2 down. 3 left today — send the next one.