
We read your photo as:
Process capability refers to a process's ability to produce output that consistently meets customer specifications.
Computer Science
ScanSolve AI Answer
Process capability refers to a process's ability to produce output that consistently meets customer specifications.
The key indicators that show capability are:
- Process Capability Index (): This measures the potential capability of a process by comparing the process spread (typically ) to the total specification spread. A value of 1.0 means the process spread equals the specification spread. Values greater than 1.0 indicate the process is potentially capable of meeting specifications.
- Process Performance Index (): This measures the actual capability of a process, taking into account both the process spread and its centering relative to the specification limits. It is the minimum of the upper and lower capability indices, reflecting how close the process mean is to the nearest specification limit. A value of 1.0 means the process is barely capable of meeting specifications, while values greater than 1.33 are generally considered good. where is the process mean and is the process standard deviation.
- Defect Rate/Parts Per Million (PPM): This indicates the number of defective items produced per million opportunities. A lower PPM signifies higher process capability, as it means fewer defects are being generated.
- Statistical Control: Before assessing capability, a process must be in statistical control, meaning its variation is stable and predictable over time, typically monitored using control charts. A process not in control cannot be reliably assessed for capability.
The data showing capability would typically include control charts demonstrating stability, and calculated and values that meet or exceed target thresholds (e.g., ). A non-capable process would show values below target, high defect rates, or a lack of statistical control.
Was this helpful?
Still stuck on this one?
Ask a follow-up, and the answer starts from this question.
Got a different question?Ask your own question
More Computer Science Questions
QProcess capability refers to the ability of a process to produce output that meets customer…QISO 9000, 3.4.1 If process is defined as "set of interrelated or interacting activities which…QI. Productivity is the rate at which goods or services are produced, often measured as output per…QWhat are the objectives of process control and what are its key components?QModule 1: Monitor and control quality control practices in a manufacturing/engineering environment…
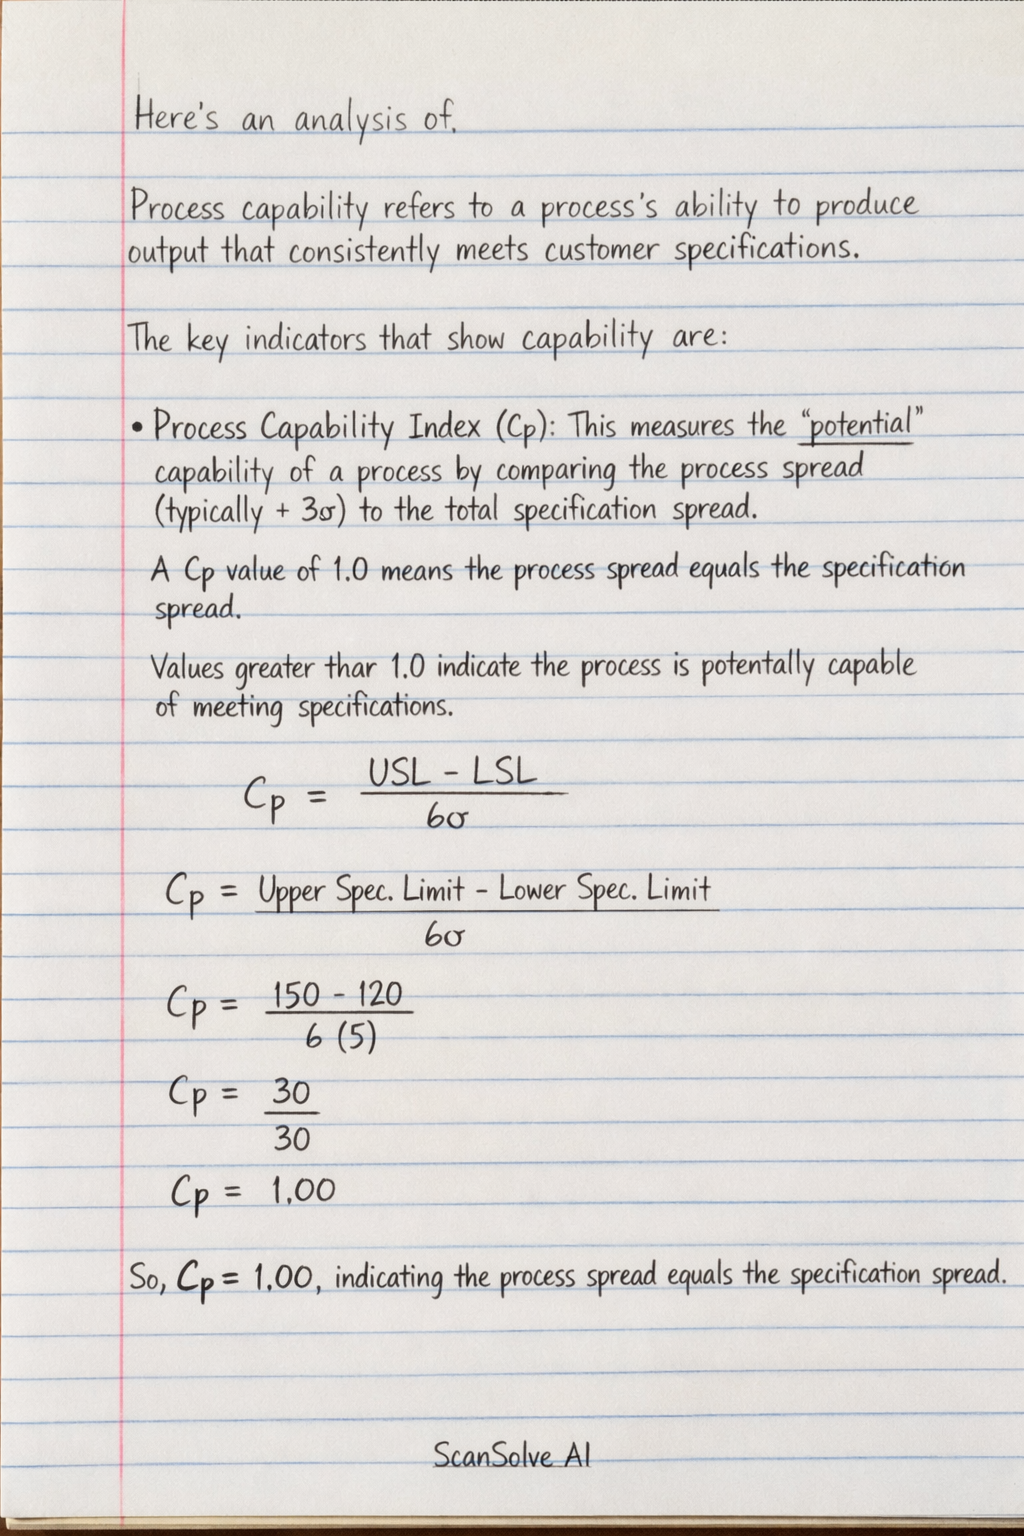
Handwritten Step-by-Step Solution
Get this as a handwritten image on WhatsApp — like a tutor wrote it for you.
Try on WhatsApp